College Political Science Quiz
17 questions · no time limit
0:00
RESEARCH METHODS
Question 1 of 17
No time limit
Current
Answered
Flagged
Not seen
The stacked bar chart below shows the level of trust in science among supporters of three different political parties. Each bar represents a political party and shows the proportion of its supporters who have low, medium, or high trust. Which statement is best supported by the chart? 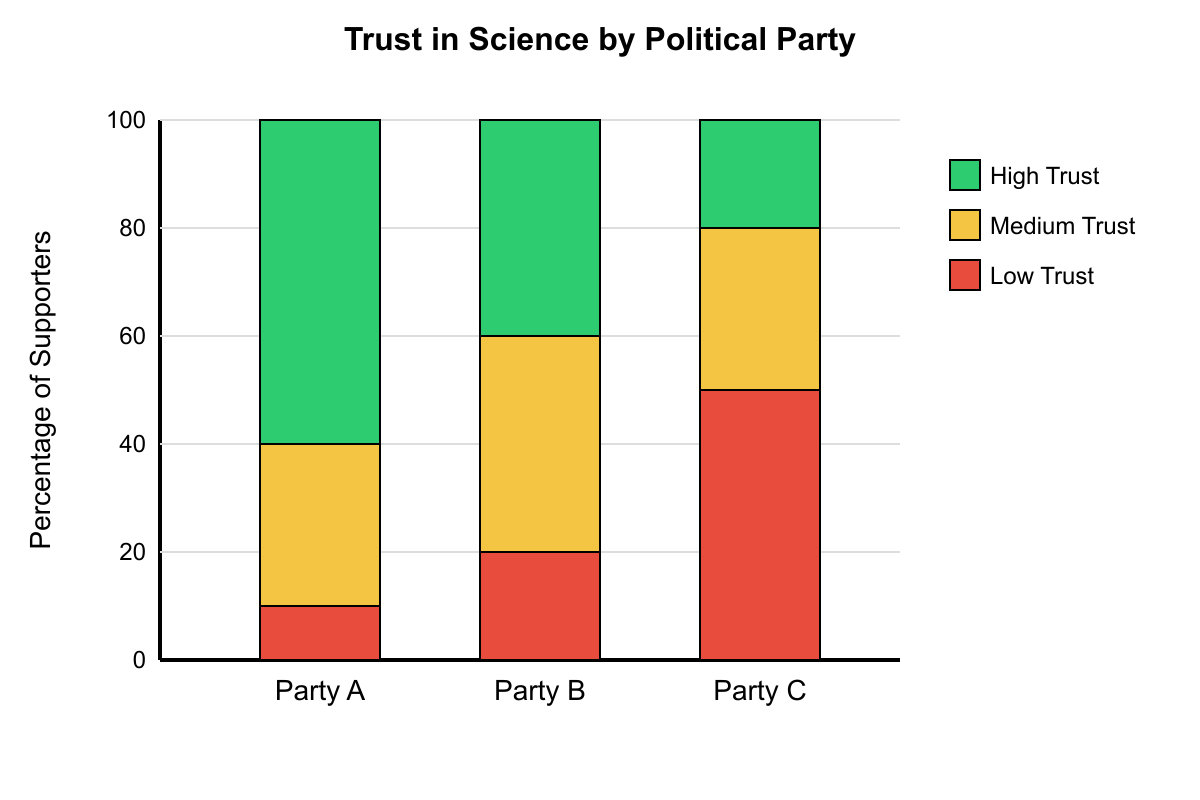
YOUR PROGRESS
17
QUESTIONS
Ready when you are
Answer in any order. Your progress shows here as you go.
QUESTIONS
KEYBOARD
Pick an answer ABCD
Next question ↵→
Previous ←
Flag for review F