College Biology Quiz
8 questions · no time limit
0:00
SCIENTIFIC PRACTICES & BIO DATA SKILLS
Question 1 of 8
No time limit
Current
Answered
Flagged
Not seen
A plant physiology experiment investigated photosynthetic responses to light intensity. The figure shows three measurement approaches: Panel A displays oxygen evolution rates, Panel B shows chlorophyll fluorescence parameters, and Panel C presents leaf temperature changes. All measurements were taken simultaneously on the same leaves at different light intensities. Error bars represent standard error (n=6). What integrated conclusion about photosynthetic performance is best supported? 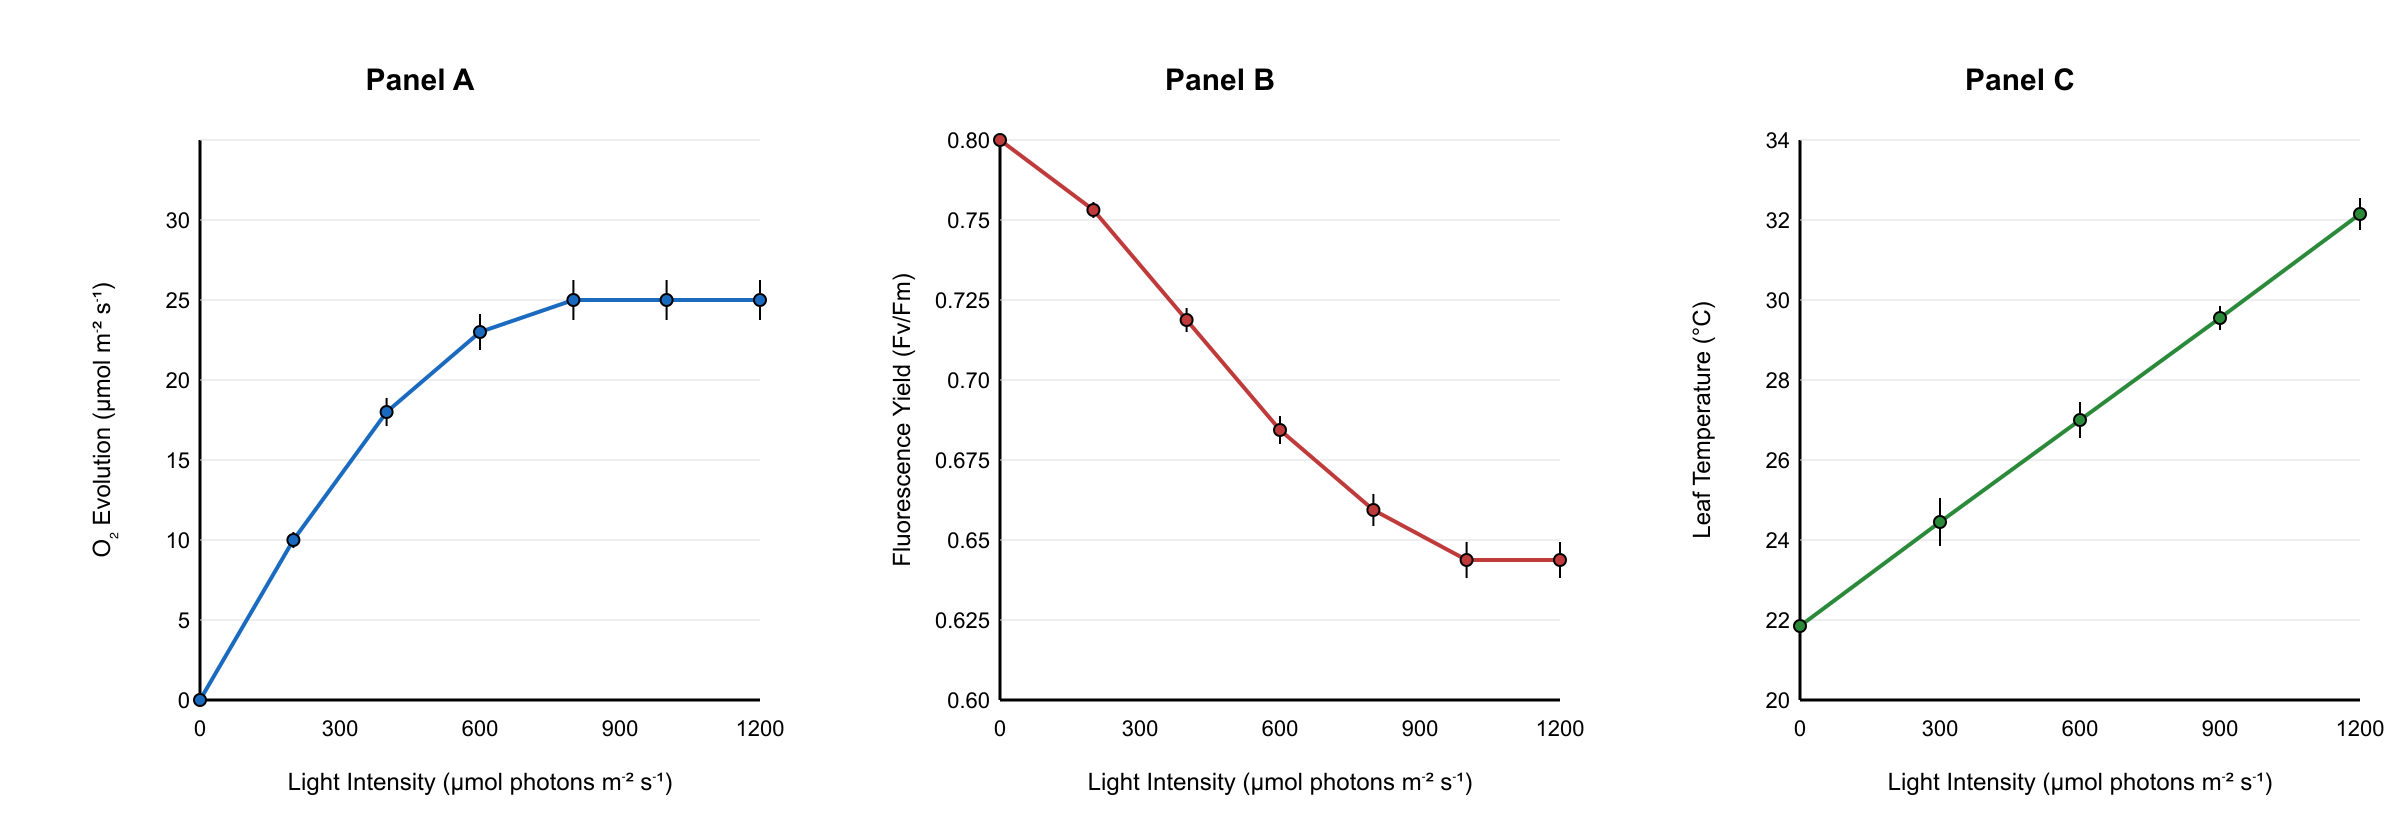
YOUR PROGRESS
8
QUESTIONS
Ready when you are
Answer in any order. Your progress shows here as you go.
QUESTIONS
KEYBOARD
Pick an answer ABCDE
Next question ↵→
Previous ←
Flag for review F