College Biology Quiz
17 questions · no time limit
0:00
SCIENTIFIC PRACTICES & BIO DATA SKILLS
Question 1 of 17
No time limit
Current
Answered
Flagged
Not seen
The heatmap below displays gene expression changes across different experimental conditions. Based on the color intensity patterns and clustering, what can be concluded about the gene expression profiles? 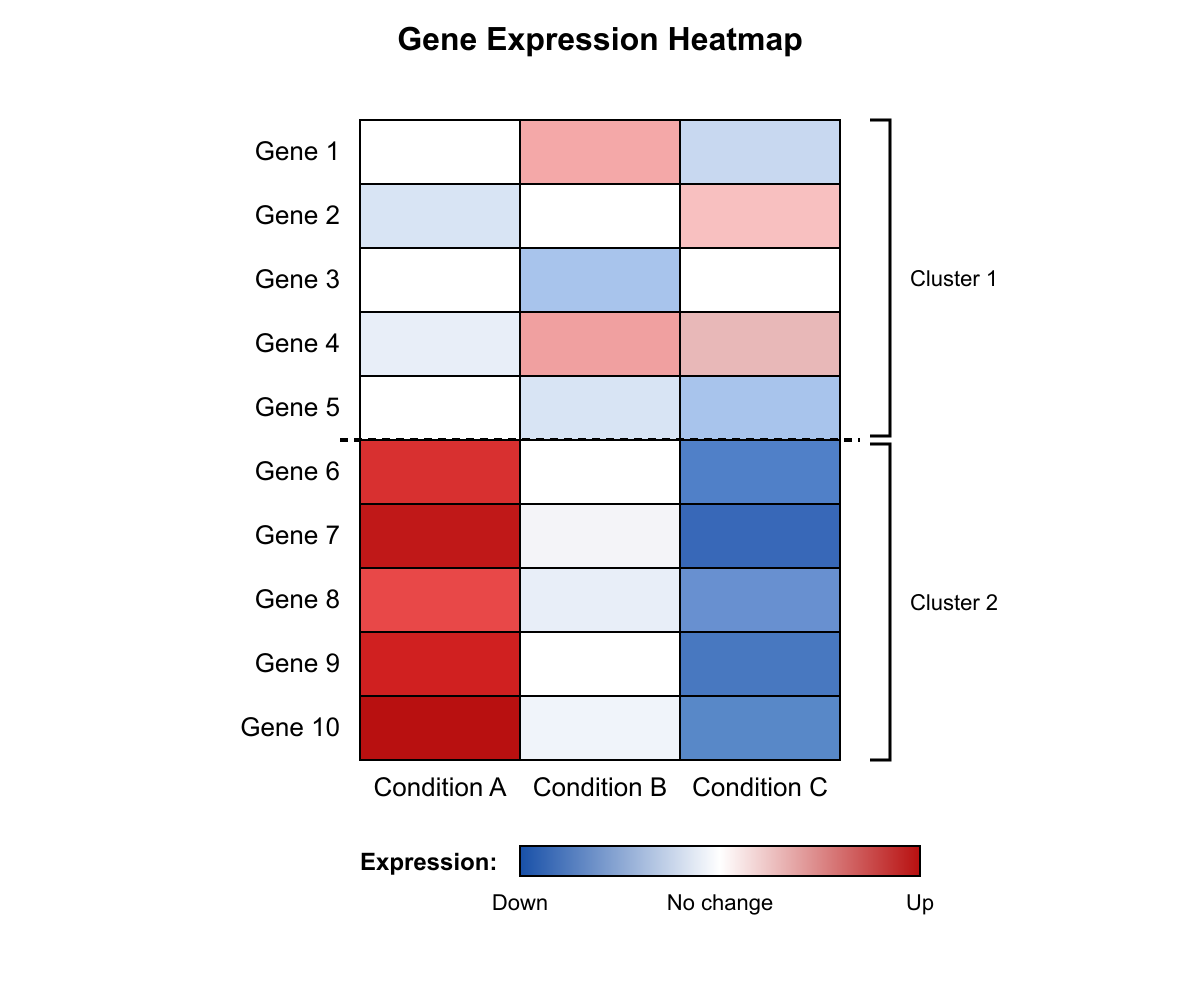
YOUR PROGRESS
17
QUESTIONS
Ready when you are
Answer in any order. Your progress shows here as you go.
QUESTIONS
KEYBOARD
Pick an answer ABCDE
Next question ↵→
Previous ←
Flag for review F