Inference Procedures:
Categorical Data
Learn to identify and select the correct inference procedure: one-sample \( z \)-test for proportions, two-sample \( z \)-test, and \( \chi^2 \) tests for categorical variables.
What Is Categorical Data?
Categorical data places each observation into one of a set of non-overlapping groups (categories). Unlike quantitative data, you count how many fall in each category rather than measuring a numerical value.
Proportions vs. Counts
Every categorical inference procedure deals with either proportions (\( \hat{p} \)) or frequency counts. Knowing which one your question targets is the first step to selecting the right test.
The Three Core Procedures
One-Proportion \( z \)-Test
Use when you have one sample and want to test whether the population proportion \( p \) equals a claimed value \( p_0 \).
Two-Proportion \( z \)-Test
Use when comparing proportions from two independent samples (or two groups in an experiment).
\( \chi^2 \) Goodness-of-Fit Test
Use when you have one categorical variable with \( k \) categories and want to test whether the observed distribution matches a hypothesized distribution.
Homogeneity vs. Independence
Both use the same formula and the same two-way table format, but the research question and sampling method differ.
| Homogeneity | Independence | |
|---|---|---|
| Question | Same distribution across populations? | Are two variables associated? |
| Sampling | Independent samples from 2+ populations | One sample, classify by 2 variables |
| Hypotheses | \( H_0 \): distributions are the same | \( H_0 \): variables are independent |
| df | \( (r - 1)(c - 1) \) for both | |
A university population with four visibly different sampling routes
 The way people or groups enter a study determines its design. Sampling within groups, selecting whole groups and assigning treatments answer different questions.
The same table shape can reflect different designs
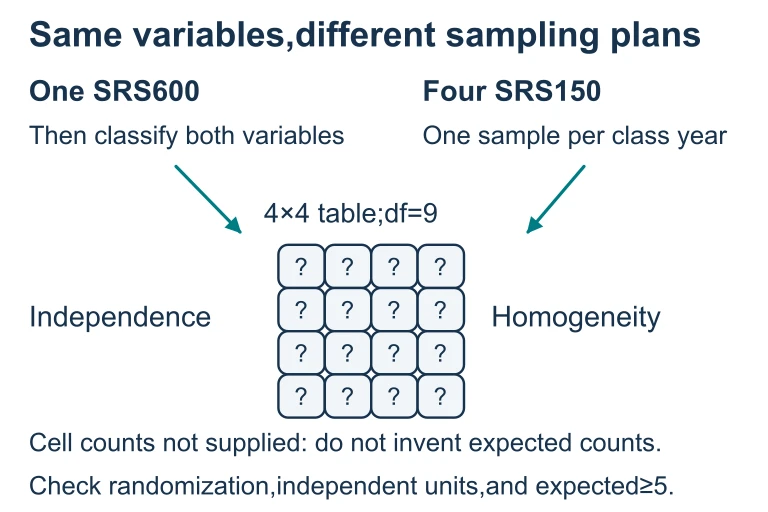 In this four-by-four setup, one SRS of 600 people classified twice supports an independence test; four separate SRSs of 150 support homogeneity. Both have df = 9. The actual cell counts are needed to calculate and check expected counts.
\( z \)-Test vs. \( \chi^2 \): When to Use Which?
The Decision Flowchart
How to Select the Right Test
Example 1: Coin Fairness
Example 2: Drug vs. Placebo
Example 3: M&M Colors
Example 4: Smoking and Education
Common Mistakes
Summary Comparison
| Procedure | Samples | Categories | Conditions |
|---|---|---|---|
| 1-Prop \( z \) | 1 | 2 (binary) | \( np_0 \geq 10 \), \( n(1-p_0) \geq 10 \) |
| 2-Prop \( z \) | 2 | 2 (binary) | Pooled large counts \( \geq 10 \) |
| \( \chi^2 \) GOF | 1 | 2+ | All \( E_i \geq 5 \) |
| \( \chi^2 \) Homogeneity | 2+ | 2+ | All \( E_i \geq 5 \) |
| \( \chi^2 \) Independence | 1 | 2+ each var | All \( E_i \geq 5 \) |
Question 1 of 5
A school principal claims that 70% of students buy lunch. A random sample of 150 students finds that 96 buy lunch. Which test should you use?
Question 2 of 5
Researchers sample 300 voters from City A and 350 from City B and record whether each supports a ballot measure. They want to know if support differs. Which test?
Question 3 of 5
A die manufacturer claims each face has a \( \frac{1}{6} \) probability. You roll the die 600 times and record the counts for each face. Which test?
Question 4 of 5
A researcher surveys one random sample of 500 employees and classifies each by department (Sales, Engineering, HR) and job satisfaction (Satisfied, Neutral, Dissatisfied). She wants to determine if satisfaction depends on department. Which test?
Question 5 of 5
Separate random samples of teens from three countries are surveyed about preferred social media platform (A, B, or C). Researchers want to know if the distribution of preferences is the same across countries. Which test?