Random Sampling
and Data Collection
Master the foundations of statistical inference by understanding how to collect data through random sampling methods that produce reliable, unbiased results.
Why Sampling Matters
In statistics, we rarely have access to an entire population: every individual or object we want to study. Instead, we collect data from a sample: a subset of the population. The quality of our conclusions depends entirely on how we select that sample.
Population vs. Sample
Bias and Variability
The Principle of Randomness
A random sample is one in which every member of the population has a known, nonzero probability of being selected. Randomness is the key tool for eliminating selection bias and allowing valid statistical inference.
Types of Random Sampling
Simple Random Sample (SRS)
Stratified vs. Cluster Sampling
A university population with four visibly different sampling routes
 The way people or groups enter a study determines its design. Sampling within groups, selecting whole groups and assigning treatments answer different questions.
Compare four sampling rules
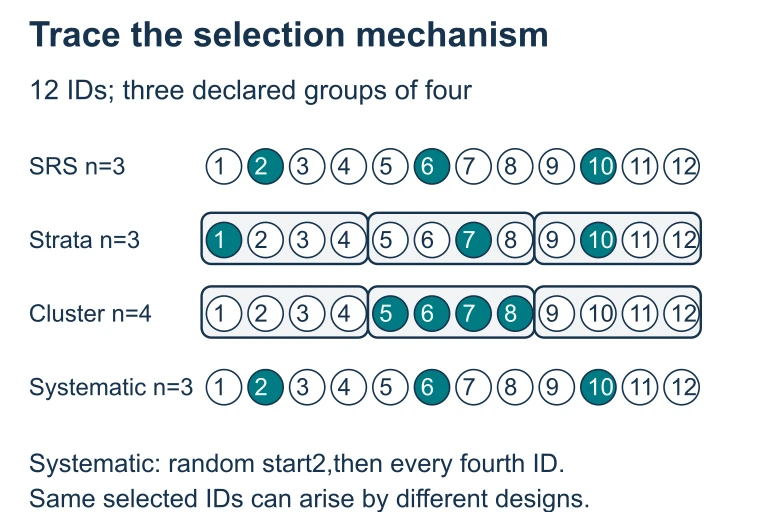 The 12-ID examples use different selection rules: an SRS selects from the whole list; stratification selects within every group; cluster sampling takes all IDs in the chosen group; systematic sampling uses a random start and fixed spacing. The selection rule, not a single realized sample, identifies the design.
Allocate a sample across every class year
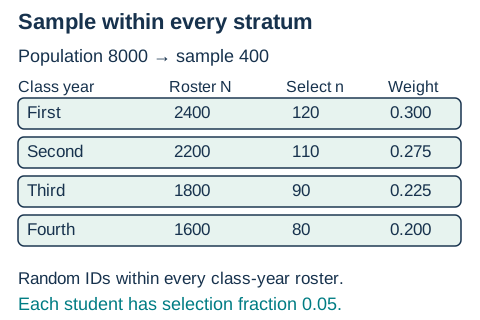 For a university with 8,000 students, allocate 400 selections as 120, 110, 90 and 80 across the four class-year rosters, then choose random IDs within each roster. Each student has a 5% selection chance; the fixed class-year allocations make this a stratified sample, not an SRS of 400.Open full diagram
Sources of Bias in Sampling
How to Conduct an SRS
Example 1: Identifying the Method
A school principal wants to survey student opinions about the lunch menu. She divides students into four grade levels (9, 10, 11, 12) and randomly selects 25 students from each grade level.
Example 2: Detecting Bias
A TV news station asks viewers to text "YES" or "NO" to the question: "Should the city build a new stadium?" They receive 12,000 responses: 78% say "NO."
Example 3: Designing a Sampling Plan
A researcher wants to estimate the average commute time for employees at a company with 5 office buildings across the city. Each building has about 200 employees. Budget allows surveying only 120 employees total.
Common Mistakes
Sampling Methods Compared
| Method | How It Works | Advantage | Limitation |
|---|---|---|---|
| SRS | Every subset of size \( n \) equally likely | Simple, unbiased | Needs full list |
| Stratified | SRS within each stratum | Reduces variability | Must know strata |
| Cluster | Randomly select clusters, sample all | Practical, cost-effective | Higher variability |
| Systematic | Every \( k \)-th individual | Easy to implement | Risk if list has pattern |
Question 1 of 5
A researcher numbers all 800 employees at a factory and uses a random number generator to select 50 of them. What type of sampling is this?
Question 2 of 5
A website posts a poll asking visitors: "Do you support the new tax?" This method is most likely to produce which type of bias?
Question 3 of 5
A school district has 40 schools. Researchers randomly select 8 schools and survey every student in those schools. This is an example of:
Question 4 of 5
Which of the following is true about increasing sample size?
Question 5 of 5
A company wants to survey employees about workplace satisfaction. They divide employees into departments (Marketing, Engineering, Sales, HR) and randomly select 15 from each. Why is this approach better than an SRS of 60 employees?