01 / 21
Sampling Icon

Potential Problems
with Sampling

Understanding bias, variability, and other pitfalls that can make your sample misleading about the population.

AP Statistics

Why Sampling Matters

In statistics, we almost never study an entire population. Instead, we collect data from a sample: a subset chosen to represent the whole. The conclusions we draw are only as good as the sample itself.

Population vs Sample

Population vs. Sample Diagram A large ellipse labeled 'Population' contains many small dots. An arrow labeled 'select' points to a smaller circle labeled 'Sample', which contains a subset of the dots from the population. This illustrates that a sample is a small group selected from a larger population. Population select Sample Inference: Use sample to learn about population

Bias vs Variability

Bias
A systematic tendency for a sampling method to consistently overestimate or underestimate the true population parameter. Increasing the sample size does not fix bias.
Variability
The natural fluctuation in sample statistics from sample to sample. Variability decreases as the sample size \( n \) increases.

The Target Analogy

Bias and Variability Target Analogy Four targets illustrate bias and variability. Low bias/low variability has shots clustered at the bullseye. Low bias/high variability has shots scattered but centered on the bullseye. High bias/low variability has shots clustered away from the bullseye. High bias/high variability has shots scattered and away from the bullseye. The bullseye represents the true population parameter. Low Bias Low Variability Low Bias High Variability High Bias Low Variability High Bias High Variability The bullseye = true population parameter

Major Types of Bias

Undercoverage
Some members of the population are left out of the sampling frame, so they have no chance of being selected.
Nonresponse
Selected individuals cannot be contacted or refuse to participate. Those who don't respond may differ systematically from those who do.
Response Bias
Responses are influenced by the wording of questions, social desirability, interviewer behavior, or the respondent's desire to please.

Undercoverage in Detail

Undercoverage Diagram A large ellipse represents the 'True Population'. A smaller, dashed ellipse inside it represents the 'Sampling Frame'. Several dots are inside the sampling frame, but some red dots are outside the frame, still within the population. These red dots are labeled 'Missed!', illustrating how undercoverage occurs when the sampling frame doesn't include the entire population. True Population Sampling Frame Missed! Missed!

Nonresponse and Response Bias

1
Nonresponse bias occurs when those who respond differ from those who don't. For example, a mailed survey about health habits may be returned mostly by health-conscious people.
2
Response bias occurs when respondents give inaccurate answers. Leading questions, social pressure, or poor memory can all distort results.
3
Wording effects: "Do you agree the government wastes tax money?" vs "Should the government spend differently?" produce very different results from the same population.

A neighborhood survey with visible routes for missing voices

A neighborhood survey shows homes, invitation routes and returned responses.A survey can lose people before selection or after invitation. Keeping the target population, sampling frame, selected sample and respondents separate reveals where each problem arises.

Track who is missing at each stage
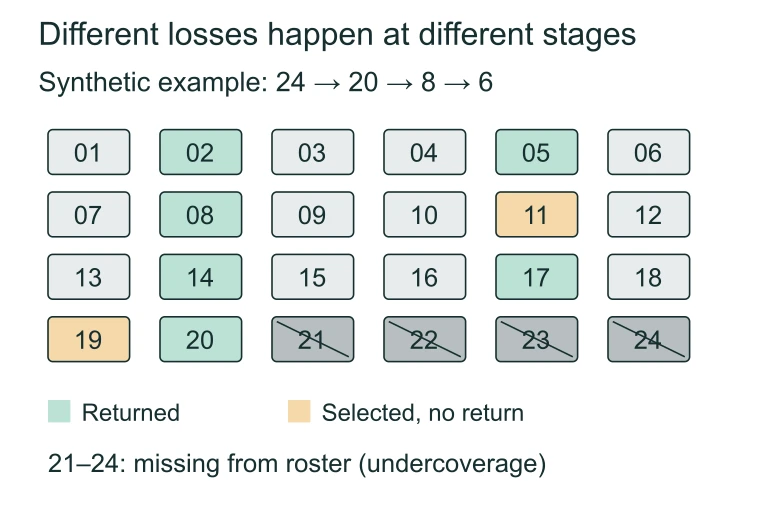
A 24-ID population narrows to a 20-ID frame, eight selected invitations and six responses.Suppose the target population has 24 IDs. The frame omits IDs 21–24; eight listed IDs are selected, and six respond. Frame omissions are undercoverage; selected people who do not respond are nonresponse. Bias direction depends on how missing responses differ.

Participation does not remove wording effects
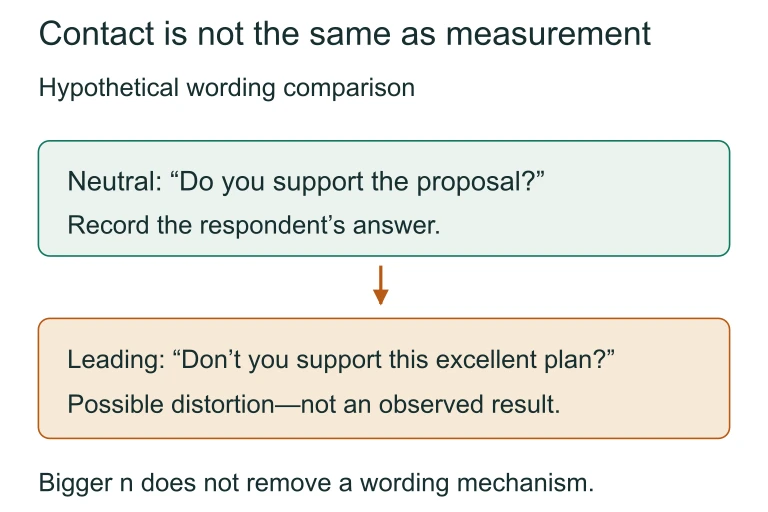
Two versions of a survey question contrast neutral phrasing with wording that encourages a particular response.A respondent can still be influenced by the wording of a question. Compare the neutral and leading versions by identifying the assumption each asks the respondent to accept.

Voluntary Response and Convenience Samples

Voluntary Response
Individuals choose themselves to participate (online polls, call-in surveys). People with strong opinions are overrepresented.
Convenience Sample
The researcher selects whoever is easiest to reach (e.g., surveying people in the school cafeteria). This rarely represents the full population.

Sampling Error vs Bias

Sampling Error (Variability) Bias
Definition Natural random variation from sample to sample Systematic tendency to miss the true value
Cause Random chance in who gets selected Flawed sampling design or method
Fix Increase sample size \( n \) Improve the sampling method
Direction Equally likely above or below truth Consistently in one direction
Reducible? Yes, with larger \( n \) No, not by increasing \( n \)

How to Identify Bias in a Study

1
Identify the population of interest. Who are we trying to learn about?
2
Identify the sampling frame. Does it include all members of the population? If not, there may be undercoverage.
3
Check the selection method. Is it random? Or voluntary/convenience? Non-random = likely biased.
4
Look for nonresponse. What fraction responded? Would non-responders likely differ from responders?
5
Examine the questions. Are they leading, confusing, or socially sensitive? Could wording influence responses?

Example 1: School Lunch Survey

A school principal wants to know how students feel about the cafeteria food. She places a suggestion box in the cafeteria and asks students to fill out a comment card if they wish.

Example 2: Mailed Health Survey

A researcher mails a 10-page health questionnaire to 5,000 randomly selected adults. Only 800 return the completed survey.

Example 3: Wording Effect

Two versions of a question are asked to separate random samples from the same population:

Version A
"Do you think the government should forbid public speeches against democracy?"
Result: 46% said yes
Version B
"Do you think the government should not allow public speeches against democracy?"
Result: 54% said yes

Common Mistakes

✕ "Bigger sample fixes everything"
Increasing \( n \) reduces variability but does not reduce bias. A biased method with \( n = 10{,}000 \) is still biased.
✕ Confusing bias types
Undercoverage, nonresponse, and response bias are different problems requiring different solutions. Name the specific type.
✕ Not explaining the direction
On the AP exam, you must state which direction the bias pushes results (overestimate or underestimate) and why.

Summary of Sampling Problems

Problem What Happens Example
Undercoverage Part of population has no chance of selection Landline-only phone survey
Nonresponse Selected people don't participate Long mailed questionnaire
Response Bias Answers are systematically inaccurate Leading or sensitive questions
Voluntary Response Self-selected sample with strong opinions Online review site ratings
Convenience Easiest-to-reach people are chosen Surveying friends at lunch

Question 1 of 5

A radio station asks listeners to call in and vote on whether a new highway should be built. What is the primary sampling concern?

Question 2 of 5

A researcher surveys a random sample of 2,000 adults by mail. Only 300 respond. The researcher reports results based on the 300 responses. What is the main problem?

Question 3 of 5

Which of the following is true about increasing sample size?

Question 4 of 5

A survey asks: "Don't you agree that the school should invest more in student wellness programs?" What type of bias is most likely present?

Question 5 of 5

Which sources of bias are most relevant in this scenario?