Introducing
Data Samples
Why is my sample not like yours? Explore sampling variability, the difference between populations and samples, and why statistics depends on the art of good sampling.
What Is a Population?
In statistics, a population is the entire group of individuals or observations that you want to study. It includes every single member that fits your criteria: every student in a school, every light bulb produced in a factory, or every voter in a country.
What Is a Sample?
A sample is a subset of the population that we actually collect data from. Because it's impractical (or impossible) to measure every member, we use the sample to estimate the population parameter.
Why Is My Sample Not Like Yours?
Every time you draw a new random sample from the same population, you'll likely get different values. This natural variation is called sampling variability. It's not a flaw: it's an inherent feature of working with subsets.
The Law of Large Numbers
As the sample size \( n \) increases, the sample mean \( \bar{x} \) gets closer and closer to the true population mean \( \mu \). This is the Law of Large Numbers: larger samples give more reliable estimates.
The Sampling Distribution
If you repeated the sampling process thousands of times and plotted every \( \bar{x} \), you'd get the sampling distribution of \( \bar{x} \). This distribution tells us how much sample means vary from sample to sample.
A filling line that deposits one statistic for a whole tray
 A tray contains individual observations, but its average contributes one value to a distribution of sample means. Repeating the sampling process reveals how that statistic varies.
One tray contributes one mean
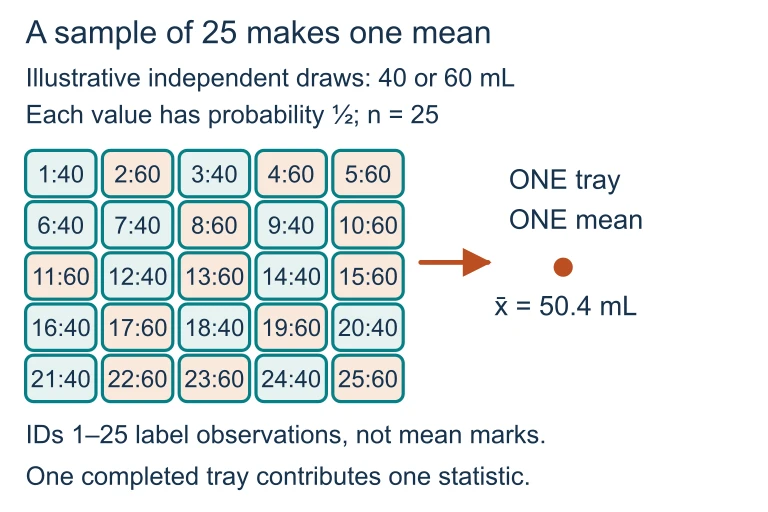 Suppose each independent fill is equally likely to be 40 or 60 mL. This tray contains twelve 40-mL and thirteen 60-mL fills, totaling 1,260 mL; its 25 observations contribute one mean, 50.4 mL.
Build the distribution of tray means
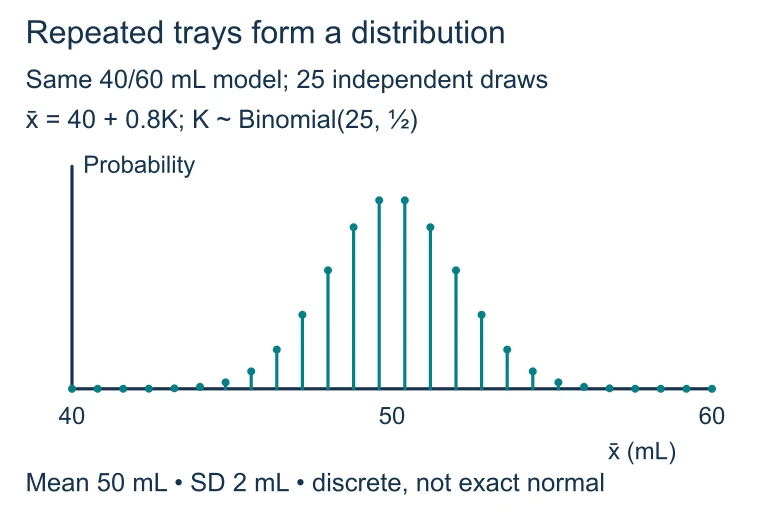 For 25 independent fills equally likely to be 40 or 60 mL, K is binomial with n = 25 and p = 0.5, and the tray mean is 40 + 0.8K. The exact distribution is discrete, centered at 50 mL with standard deviation 2 mL. A normal curve approximates its shape.
Parameter vs. Statistic
| Parameter | Statistic | |
|---|---|---|
| Describes | Population | Sample |
| Notation (mean) | \( \mu \) | \( \bar{x} \) |
| Notation (proportion) | \( p \) | \( \hat{p} \) |
| Notation (std. dev.) | \( \sigma \) | \( s \) |
| Value | Fixed but usually unknown | Varies from sample to sample |
| Mnemonic | Population → Parameter | Sample → Statistic |
Types of Random Sampling
Steps for Good Sampling
Sources of Bias
Example: School Lunch Survey
A school principal wants to estimate the proportion of students who prefer hot lunch. The school has 1,200 students. She surveys 50 students in the cafeteria during lunch period and finds \( \hat{p} = 0.72 \).
Example: Calculating Standard Error
A population of test scores has \( \mu = 500 \) and \( \sigma = 100 \). You take a random sample of \( n = 25 \) students. What is the standard error of \( \bar{x} \)?
Example: Stratified vs. SRS
A company with 300 managers and 1,700 hourly workers wants to estimate average job satisfaction. Which method is better?
Variability vs. Bias
Common Mistakes
Key Concepts Summary
| Concept | Definition | Key Fact |
|---|---|---|
| Population | Entire group of interest | Described by parameters |
| Sample | Subset actually observed | Described by statistics |
| Sampling Variability | Statistics differ sample to sample | Decreases as \( n \) increases |
| Bias | Systematic error in method | Does NOT decrease with \( n \) |
| Standard Error | \( \frac{\sigma}{\sqrt{n}} \) | Measures spread of \( \bar{x} \) |
Question 1 of 5
A researcher surveys every student in a school about screen time. The average screen time she calculates is best described as:
Question 2 of 5
A radio station asks listeners to call in and vote on their favorite song. This is an example of:
Question 3 of 5
A population has \( \sigma = 40 \). If the sample size increases from \( n = 16 \) to \( n = 64 \), the standard error of \( \bar{x} \):
Question 4 of 5
A polling company consistently overestimates support for a candidate by 3 percentage points across many polls. Increasing the sample size to \( n = 10{,}000 \) will:
Question 5 of 5
A school has 400 freshmen, 350 sophomores, 300 juniors, and 250 seniors. To ensure each grade is represented proportionally in a sample of 130, which method should be used?