How Collected Data
Tells The Truth
Understanding when your data accurately represents reality and how bias, variability, and study design determine whether conclusions are trustworthy.
What Does "Truth" Mean in Statistics?
In statistics, "truth" means our collected data faithfully reflects the population we are studying. Every dataset is just a snapshot: the question is whether that snapshot is clear and accurate or blurry and misleading.
Key Vocabulary You Need
From Population to Conclusion
Bias vs. Variability: The Two Enemies
Two forces can prevent data from telling the truth. Bias makes your estimates systematically too high or too low. Variability makes your estimates scattered and imprecise from sample to sample.
Common Sources of Bias
A neighborhood survey with visible routes for missing voices
 A survey can lose people before selection or after invitation. Keeping the target population, sampling frame, selected sample and respondents separate reveals where each problem arises.
Track who is missing at each stage
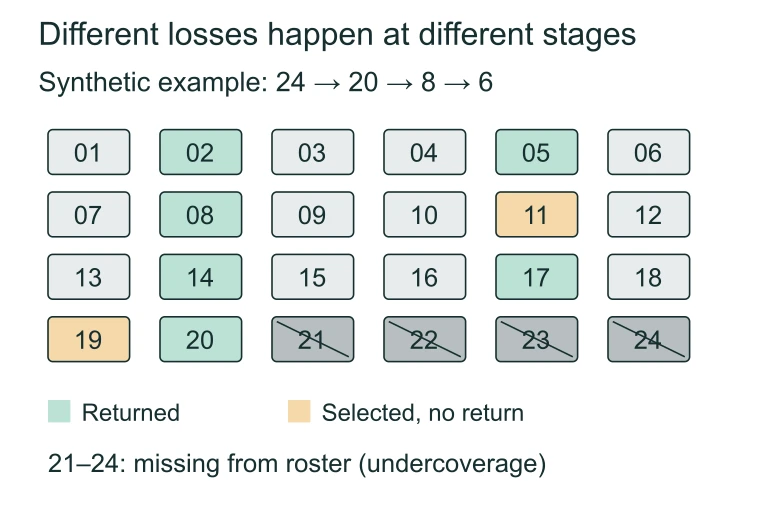 Suppose the target population has 24 IDs. The frame omits IDs 21–24; eight listed IDs are selected, and six respond. Frame omissions are undercoverage; selected people who do not respond are nonresponse. Bias direction depends on how missing responses differ.
Participation does not remove wording effects
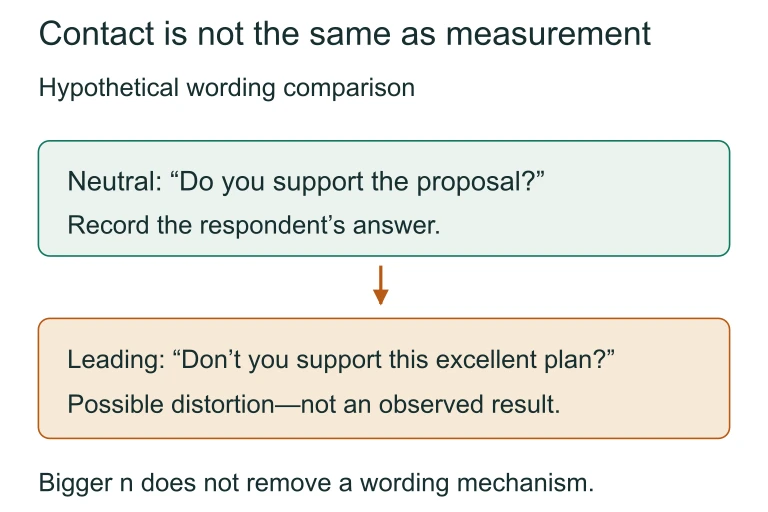 A respondent can still be influenced by the wording of a question. Compare the neutral and leading versions by identifying the assumption each asks the respondent to accept.
Reducing Variability with Sample Size
Larger samples produce less variability in statistics. The standard error of the sample mean decreases as \(n\) increases:
Observational vs. Experimental Studies
| Observational Study | Experiment | |
|---|---|---|
| Researcher role | Observes without intervening | Imposes a treatment |
| Causation? | Cannot establish | Can establish |
| Confounding | Likely present | Controlled via randomization |
| Example | Survey of coffee drinkers' heart rates | Randomly assign caffeine vs. placebo |
The Danger of Confounding Variables
A confounding variable is an unmeasured factor that is associated with both the explanatory variable and the response variable. It makes you think X causes Y, when really Z is driving both.
Principles of Good Study Design
How to Evaluate Whether Data Tells the Truth
Example 1: School Lunch Survey
A school wants to know if students are satisfied with lunch options. They survey every student who visits the cafeteria during one lunch period on a Tuesday.
Example 2: Exercise and Grades
A researcher observes that students who exercise regularly have higher GPAs. She concludes: "Exercise causes higher grades."
Example 3: Well-Designed Experiment
Researchers want to test whether a new study app improves test scores. They randomly assign 200 students to use the app or a traditional textbook for 4 weeks, then compare exam results.
Common Mistakes to Avoid
Summary: When Does Data Tell the Truth?
| Condition | Data Tells Truth | Data Misleads |
|---|---|---|
| Sampling method | Random selection | Convenience or voluntary |
| Sample size | Large \(n\): low variability | Small \(n\): high variability |
| Bias | Minimal: fair questions, full participation | Selection, response, or nonresponse bias |
| Confounders | Controlled via randomization | Lurking variables ignored |
| Causation claim | Only from experiments with random assignment | Claimed from observational data |
Question 1 of 5
A researcher finds that people who own pets tend to have lower blood pressure. She concludes that pet ownership causes lower blood pressure. What is the primary flaw in this conclusion?
Question 2 of 5
A news website posts a poll asking readers: "Do you support the new tax proposal?" and 82% say no. Why should we be skeptical of this result?
Question 3 of 5
If the population standard deviation is \(\sigma = 12\) and we take a sample of size \(n = 36\), what is the standard error of the sample mean?
Question 4 of 5
Which of the following is the best way to reduce bias in a sample survey?
Question 5 of 5
Study description: A company tests a new fertilizer. They apply it to 50 randomly selected plots in a large field and leave 50 other randomly selected plots untreated. After 8 weeks, they measure crop yield in all 100 plots. The fertilized plots produce an average of 15% more crop yield.
Based on this study, which conclusion is most justified?