Expected Counts in
Two-Way Tables
Learn how to calculate the expected frequency for each cell under the assumption of independence, and why it matters for the chi-square test.
What Is a Two-Way Table?
A two-way table (also called a contingency table) displays the frequency counts for two categorical variables. Rows represent one variable, columns represent another, and each cell shows how many observations fall into that combination.
| Prefer Dogs | Prefer Cats | Total | |
|---|---|---|---|
| Male | 36 | 24 | 60 |
| Female | 30 | 10 | 40 |
| Total | 66 | 34 | 100 |
Observed vs. Expected Counts
Why Independence Matters
Two categorical variables are independent if knowing the value of one variable tells you nothing about the other. Under independence, the proportion in each row should match the overall column proportion, and vice versa.
The Expected Count Formula
For any cell in a two-way table, its expected count is calculated by multiplying its row total by its column total, then dividing by the grand total (the total number of observations).
Formula in Formal Notation
Marginal vs. Joint vs. Conditional
| Marginal | Joint | Conditional | |
|---|---|---|---|
| Definition | Totals in one variable only | Count in a specific cell | Proportion within a row or column |
| Location | Row/column totals (margins) | Interior cells | Calculated from interior cells |
| Example | "60 males total" | "36 males prefer dogs" | "60% of males prefer dogs" |
| Used in formula | \( R_i \) and \( C_j \) | Observed \( O_{ij} \) | Not directly |
How to Calculate Expected Counts
Worked Example: Pet Preference
Using our earlier table, find the expected count for "Male and Prefer Dogs."
| Dogs | Cats | Total | |
|---|---|---|---|
| Male | 36 | 24 | 60 |
| Female | 30 | 10 | 40 |
| Total | 66 | 34 | 100 |
Complete Expected Counts Table
Apply the formula to every cell:
| Dogs | Cats | Total | |
|---|---|---|---|
| Male | \(\frac{60 \times 66}{100} = 39.6\) | \(\frac{60 \times 34}{100} = 20.4\) | 60 |
| Female | \(\frac{40 \times 66}{100} = 26.4\) | \(\frac{40 \times 34}{100} = 13.6\) | 40 |
| Total | 66 | 34 | 100 |
Worked Example 2: Study Habits
A survey of 200 students recorded their grade level and preferred study method:
| Alone | Group | Tutor | Total | |
|---|---|---|---|---|
| Freshman | 30 | 20 | 10 | 60 |
| Sophomore | 25 | 35 | 20 | 80 |
| Junior | 20 | 25 | 15 | 60 |
| Total | 75 | 80 | 45 | 200 |
Full Expected Table for Study Habits
| Alone | Group | Tutor | Total | |
|---|---|---|---|---|
| Freshman | 22.5 | 24 | 13.5 | 60 |
| Sophomore | 30 | 32 | 18 | 80 |
| Junior | 22.5 | 24 | 13.5 | 60 |
| Total | 75 | 80 | 45 | 200 |
Connecting to the Chi-Square Statistic
Expected counts are essential because they feed directly into the chi-square test statistic:
Conditions Involving Expected Counts
Before performing a chi-square test, you must verify that all expected counts are large enough for the approximation to be valid:
Common Mistakes to Avoid
Summary Comparison
| Observed Counts | Expected Counts | |
|---|---|---|
| Source | Collected from data | Calculated from formula |
| Values | Always whole numbers | Often decimals |
| Assumption | None: raw reality | Variables are independent |
| Formula | N/A (given in table) | \( \frac{R_i \times C_j}{n} \) |
| Role in \( \chi^2 \) | \( O \) in \( \frac{(O - E)^2}{E} \) | \( E \) in \( \frac{(O - E)^2}{E} \) |
| Condition check | Not checked | All cells must be \( \geq 5 \) |
Worked Example
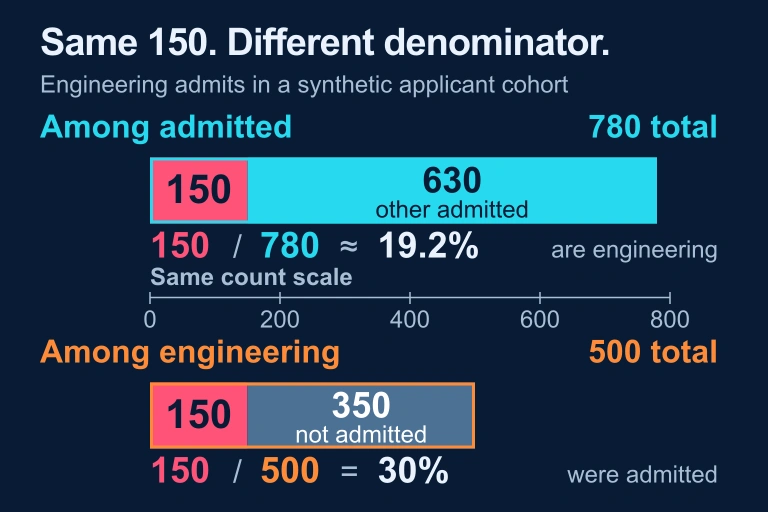
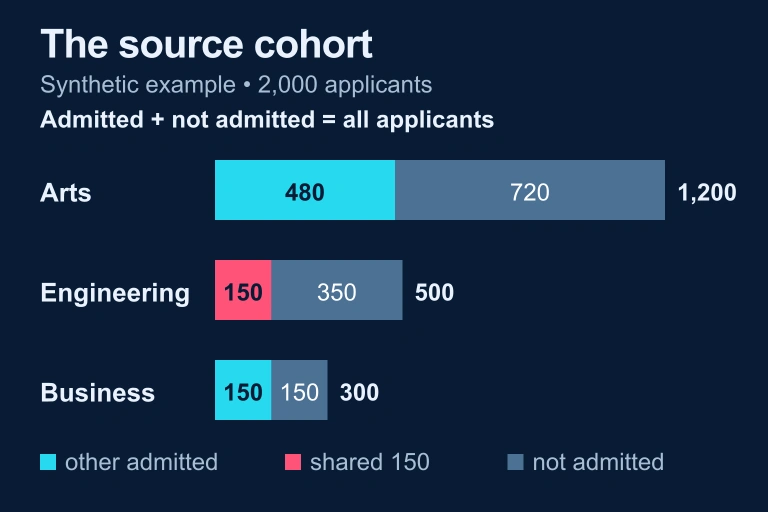
A university admissions office wants to investigate whether admission status (Admitted, Denied) is associated with the applicant's intended major (Engineering, Business, Liberal Arts). A random sample of 400 applicants yields the following observed counts. | Engineering | Business | Liberal Arts | Row Total Admitted | 80 | 60 | 100 | 240 Denied | 40 | 60 | 60 | 160 Col Total | 120 | 120 | 160 | 400 Computing Expected Counts & Chi-Square Statistic Step 1 — Identify Marginal Totals Row totals: Admitted = 240, Denied = 160. Column totals: Engineering = 120, Business = 120, Liberal Arts = 160. Grand total n = 400. Step 2 — Compute Expected Counts Apply E_(ij) = (R_(i) × C_(j)) / n for each cell. Admitted-Engineering: (240 × 120)/400 = 72. Admitted-Business: (240 × 120)/400 = 72. Admitted-Liberal Arts: (240 × 160)/400 = 96. Denied-Engineering: (160 × 120)/400 = 48. Denied-Business: (160 × 120)/400 = 48. Denied-Liberal Arts: (160 × 160)/400 = 64. Expected counts: 72, 72, 96, 48, 48, 64 — all ≥ 5 ✓ Step 3 — Verify Marginal Sums Admitted row: 72 + 72 + 96 = 240 ✓. Denied row: 48 + 48 + 64 = 160 ✓. Engineering column: 72 + 48 = 120 ✓. Business column: 72 + 48 = 120 ✓. Liberal Arts column: 96 + 64 = 160 ✓. Step 4 — Compute Chi-Square Contributions For each cell, compute (O − E)² / E. Admitted-Eng: (80 − 72)² / 72 = 64/72 ≈ 0.889. Admitted-Bus: (60 − 72)² / 72 = 144/72 = 2.000. Admitted-LA: (100 − 96)² / 96 = 16/96 ≈ 0.167. Denied-Eng: (40 − 48)² / 48 = 64/48 ≈ 1.333. Denied-Bus: (60 − 48)² / 48 = 144/48 = 3.000. Denied-LA: (60 − 64)² / 64 = 16/64 = 0.250. Step 5 — Sum and Interpret χ² = 0.889 + 2.000 + 0.167 + 1.333 + 3.000 + 0.250 = 7.639. Degrees of freedom: (2 − 1)(3 − 1) = 2. Using a chi-square distribution with df = 2, the p-value is approximately 0.022. At α = 0.05, we reject the null hypothesis and conclude that there is statistically significant evidence of an association between admission status and intended major. χ² = 7.639, df = 2, p ≈ 0.022 → Reject H₀ at α = 0.05 Separate 2,000-applicant illustration: an expected count here is 500×780/2000=195. Preserve the original 400-observation table with expected rows [72,72,96] and [48,48,64].
Question 1 of 5
In a two-way table with a grand total of 150, a particular row total is 50 and the corresponding column total is 90. What is the expected count for that cell?
Question 2 of 5
Which condition must be satisfied by expected counts before performing a chi-square test?
Question 3 of 5
A two-way table has row totals of 40 and 60, and column totals of 55 and 45. The grand total is 100. What is the expected count for the cell in row 1, column 2?
Question 4 of 5
If the observed count in a cell is 28 and the expected count is 20, what is the contribution of this cell to the chi-square statistic?
Question 5 of 5
Two rows in a two-way table have the same row total. Which of the following must be true about their expected counts?