01 / 21
\(\hat{p}_1\)
\(\hat{p}_2\)

Difference of Two
Population Proportions

Learn how to carry out a significance test comparing two population proportions: state hypotheses, check conditions, compute the z-statistic, and draw conclusions.

AP Statistics

When Do We Compare Proportions?

Many real-world questions involve comparing two groups: Does a new drug cure a higher proportion of patients than a placebo? Do men and women differ in their support for a policy? Each group has its own population proportion, \( p_1 \) and \( p_2 \).

\( p_1 \)
True proportion for Population 1 (e.g., treatment group)
\( p_2 \)
True proportion for Population 2 (e.g., control group)

Parameters vs. Statistics

We never observe the true population proportions directly. Instead, we collect random samples and compute sample proportions.

Parameters
\( p_1 \) and \( p_2 \): the unknown population proportions we want to compare
Statistics
\( \hat{p}_1 = \frac{x_1}{n_1} \) and \( \hat{p}_2 = \frac{x_2}{n_2} \): the observed sample proportions

The Big Picture: Test Framework

Hypotheses Conditions Test Statistic Conclusion

Every two-proportion z-test follows four stages: state the null and alternative hypotheses, verify the conditions, compute the z-statistic and p-value, and make a decision in context.

Setting Up Hypotheses

The null hypothesis always assumes no difference. The alternative depends on the research question.

H₀
Null: \( H_0 \colon p_1 - p_2 = 0 \) (equivalently, \( p_1 = p_2 \))
Hₐ
Two-sided: \( H_a \colon p_1 - p_2 \neq 0 \)
Hₐ
One-sided: \( H_a \colon p_1 - p_2 > 0 \)  or  \( H_a \colon p_1 - p_2 < 0 \)

Checking Conditions

Random
Both samples are collected using a random process (random sampling or random assignment).
10% Rule
\( n_1 \leq \frac{1}{10}N_1 \) and \( n_2 \leq \frac{1}{10}N_2 \). Each sample is no more than 10% of its population.
Large Counts
Using the pooled proportion \( \hat{p}_c \): all of \( n_1\hat{p}_c,\; n_1(1-\hat{p}_c),\; n_2\hat{p}_c,\; n_2(1-\hat{p}_c) \geq 10 \).

The Pooled Proportion \( \hat{p}_c \)

Under \( H_0 \), we assume \( p_1 = p_2 \). Our best single estimate of that common proportion pools both samples:

This pooled estimate is used in both the standard error formula and the Large Counts condition for a hypothesis test.

Computing the z-Statistic

Numerator
The observed difference \( \hat{p}_1 - \hat{p}_2 \) minus the hypothesized difference (0 under \( H_0 \)).
Denominator
The pooled standard error: how much \( \hat{p}_1 - \hat{p}_2 \) varies when \( H_0 \) is true.

P-value and Decision

0
\(+z\)
\(-z\)
\(\frac{p}{2}\)
\(\frac{p}{2}\)
Two-sided p-value = both tails
1
Find the p-value: the probability of getting a z-statistic at least as extreme as the one observed, assuming \( H_0 \) is true.
2
Compare to \( \alpha \): if p-value \( \leq \alpha \), reject \( H_0 \). Otherwise, fail to reject.
3
State the conclusion in context: "We have / do not have convincing evidence that..."

Test vs. Confidence Interval

Significance Test Confidence Interval
Purpose Is there a difference? How big is the difference?
Standard Error Pooled \( \hat{p}_c \) Unpooled \( \hat{p}_1, \hat{p}_2 \)
Output z-statistic and p-value Interval estimate
Large Counts Uses \( \hat{p}_c \) Uses \( \hat{p}_1 \) and \( \hat{p}_2 \)

Step-by-Step Procedure

1
State hypotheses: Define \( p_1 \) and \( p_2 \) in context. Write \( H_0 \colon p_1 - p_2 = 0 \) and choose \( H_a \).
2
Check conditions: Random, 10% rule, and Large Counts (using \( \hat{p}_c \)).
3
Calculate: Compute \( \hat{p}_c \), then the pooled SE, then \( z \), then the p-value.
4
Conclude: Compare p-value to \( \alpha \). State decision and interpret in context.

Example 1: Vaccine Trial

A researcher tests whether a new vaccine reduces infections. In the treatment group, 40 of 200 got infected. In the control group, 60 of 200 got infected. Test at \( \alpha = 0.05 \).

Treatment
\( x_1 = 40,\; n_1 = 200 \)
\( \hat{p}_1 = 0.20 \)
Control
\( x_2 = 60,\; n_2 = 200 \)
\( \hat{p}_2 = 0.30 \)

Example 1: Calculations

1
Pooled proportion: \( \hat{p}_c = \dfrac{40 + 60}{200 + 200} = \dfrac{100}{400} = 0.25 \)
2
Large Counts: \( 200(0.25)=50 \geq 10 \), \( 200(0.75)=150 \geq 10 \) for both groups. ✓
3
SE: \( \sqrt{0.25(0.75)\left(\frac{1}{200}+\frac{1}{200}\right)} = \sqrt{0.001875} \approx 0.0433 \)
4
z-statistic: \( z = \dfrac{0.20 - 0.30}{0.0433} \approx -2.31 \)

Example 2: Voter Preference

In a random sample, 120 of 400 women and 100 of 400 men support a new policy. Is there a significant difference at \( \alpha = 0.05 \)?

1
Hypotheses: \( H_0 \colon p_W - p_M = 0 \) vs. \( H_a \colon p_W - p_M \neq 0 \) (two-sided)
2
Pooled: \( \hat{p}_c = \frac{120+100}{800} = 0.275 \). Large Counts: \( 400(0.275) = 110 \geq 10 \) ✓
3
SE: \( \sqrt{0.275(0.725)\!\left(\frac{1}{400}+\frac{1}{400}\right)} \approx 0.0316 \)
4
z-statistic: \( z = \frac{0.30-0.25}{0.0316} \approx 1.58 \). P-value \( \approx 2(0.0571) = 0.114 \).

Example 3: Online vs. In-Store

A retailer randomly surveys customers. Of 150 online shoppers, 45 returned an item. Of 250 in-store shoppers, 50 returned an item. Test whether online return rates are higher (\( \alpha = 0.01 \)).

Online
\( \hat{p}_1 = \frac{45}{150} = 0.30 \)
In-Store
\( \hat{p}_2 = \frac{50}{250} = 0.20 \)
Pooled
\( \hat{p}_c = \frac{95}{400} = 0.2375 \)

Common Mistakes

✕ Using Unpooled SE
For a test, always use the pooled \( \hat{p}_c \) in the SE formula. Save unpooled for confidence intervals.
✕ Wrong Tail Direction
If \( H_a \colon p_1 - p_2 < 0 \), the p-value is the left tail. A two-sided test doubles the one-tail area.
✕ No Context in Conclusion
Saying "reject \( H_0 \)" alone loses credit. Always state the conclusion in terms of the original question.

Worked Example

A researcher randomly assigns 250 patients to receive a new drug and 250 patients to receive a placebo. In the drug group, 180 out of 250 show symptom improvement. In the placebo group, 155 out of 250 show improvement. At α = 0.05, is there convincing evidence that the drug produces a higher improvement rate than the placebo? Step 1 — State Hypotheses Let p₁ = the true proportion who improve with the drug and p₂ = the true proportion who improve with the placebo. H₀: p₁ − p₂ = 0 (no difference). Hₐ: p₁ − p₂ > 0 (the drug is better). This is a one-sided test (right-tailed). Step 2 — Check Conditions Random: Patients were randomly assigned to treatment groups. ✓ Independent: Random assignment supports the treatment comparison. The z-test also assumes independent individual responses and no material clustering or interference; these conditions must be justified by the study design. Large Counts: We need p̂_c first (computed in Step 3): p̂_c = 0.67. Then n₁p̂_c = 250 × 0.67 = 167.5 ≥ 10, n₁(1−p̂_c) = 82.5 ≥ 10, n₂p̂_c = 167.5 ≥ 10, n₂(1−p̂_c) = 82.5 ≥ 10. ✓ The large-count condition is met; the analysis is conditional on the independence assumptions above. Step 3 — Compute Pooled Proportion p̂₁ = 180/250 = 0.72. p̂₂ = 155/250 = 0.62. The pooled proportion is: p̂_c = (180 + 155) / (250 + 250) = 335 / 500 = 0.67 Step 4 — Compute Standard Error SE = √[ 0.67 × 0.33 × (1/250 + 1/250) ] = √[ 0.2211 × 0.008 ] = √0.001769 SE ≈ 0.04206 Step 5 — Compute Test Statistic z = (p̂₁ − p̂₂) / SE = (0.72 − 0.62) / 0.04206 = 0.10 / 0.04206 z ≈ 2.377 Step 6 — Find P-Value Since Hₐ is one-sided (>), the p-value = P(Z ≥ 2.377). Using the standard normal table or calculator: p-value ≈ 0.0087. p-value ≈ 0.0087 Step 7 — State Conclusion in Context Conditional on those study-design assumptions, because the p-value (0.0087) is less than α = 0.05, we reject H₀. There is convincing evidence that the proportion of patients who improve is higher for the drug group than for the placebo group.
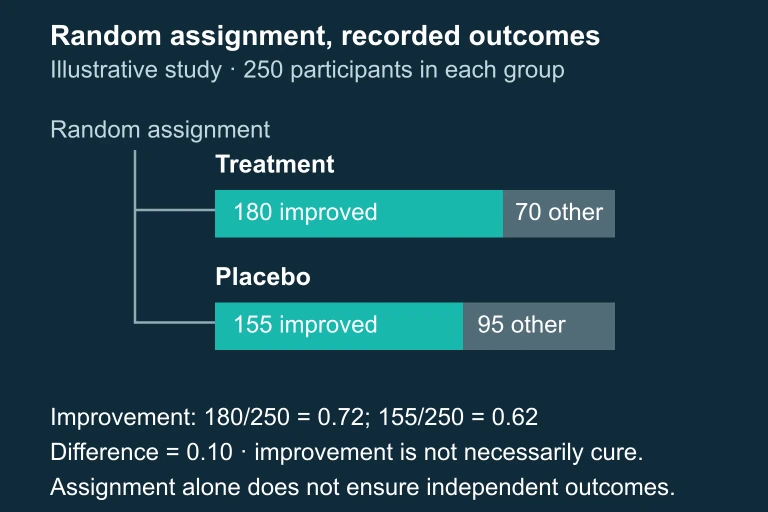
Random assignment to two groups of 250, with 180 improved and 70 not improved in one group, and 155 improved and 95 not improved in the other. Proportions are 0.72 and 0.62.
The assigned treatment and placebo groups have observed improvement fractions 0.72 and 0.62; random assignment does not by itself guarantee independent outcomes.

Question 1 of 5

In a two-proportion z-test, why do we use a pooled proportion \( \hat{p}_c \) instead of the individual sample proportions?

Question 2 of 5

In a study, \( \hat{p}_1 = 0.45 \), \( n_1 = 100 \), \( \hat{p}_2 = 0.35 \), \( n_2 = 120 \). What is \( \hat{p}_c \)?

Question 3 of 5

A test yields \( z = -1.85 \) for \( H_a \colon p_1 - p_2 < 0 \). What is the p-value?

Question 4 of 5

Which condition check uses the pooled proportion \( \hat{p}_c \) in a two-proportion z-test?

Question 5 of 5

A two-sided test at \( \alpha = 0.05 \) gives a p-value of 0.038. Which conclusion is most appropriate?