01 / 20

Concluding Tests for a
Population Proportion

Master the final step of significance testing: comparing p-values to significance levels, making reject or fail-to-reject decisions, and writing conclusions in context.

AP Statistics

What Is a Hypothesis Test?

A hypothesis test for a population proportion \( p \) asks whether sample data provide convincing evidence against a claimed value \( p_0 \). We frame the question with two competing statements:

\( H_0 \): Null Hypothesis
The "status quo." States that \( p = p_0 \). Assumed true until evidence says otherwise.
\( H_a \): Alternative Hypothesis
The claim we suspect is true. Can be \( p \neq p_0 \), \( p > p_0 \), or \( p < p_0 \).

Understanding the p-value

The p-value is the probability of obtaining a test statistic at least as extreme as the observed one, assuming \( H_0 \) is true. It measures how surprising the sample result is under the null hypothesis.

0 z observed p-value Standard Normal Distribution

The Significance Level \( \alpha \)

The significance level \( \alpha \) is the threshold we set before collecting data. It is the maximum p-value for which we will reject \( H_0 \). Common choices:

\( \alpha = 0.10 \)
More lenient. Easier to reject \( H_0 \). Higher risk of Type I error.
\( \alpha = 0.05 \)
Most common standard in AP Statistics. Balances risk and sensitivity.
\( \alpha = 0.01 \)
Very strict. Requires strong evidence to reject. Lower Type I error risk.

The Decision Rule

The entire conclusion hinges on one comparison:

Reject H₀
\( \text{p-value} \le \alpha \)
Evidence IS convincing Fail to Reject H₀
\( \text{p-value} > \alpha \)
Evidence is NOT convincing Compare p-value to α

Reject vs. Fail to Reject

Reject \( H_0 \) Fail to Reject \( H_0 \)
Condition p-value \( \leq \alpha \) p-value \( > \alpha \)
Evidence Convincing evidence for \( H_a \) Not convincing evidence for \( H_a \)
Language "We have convincing evidence that..." "We do not have convincing evidence that..."
Error Risk Type I error possible Type II error possible

Writing Conclusions in Context

A complete AP conclusion requires three components. Missing any one can cost you points:

1
State the decision. "Because the p-value of ___ is less than (or greater than) \( \alpha = \)___..."
2
Reject or fail to reject \( H_0 \). Use exact language: "we reject \( H_0 \)" or "we fail to reject \( H_0 \)."
3
State the conclusion in context. "There is / is not convincing evidence that [specific claim about \( p \) in the problem's real-world setting]."

Step-by-Step: How to Conclude

1
Identify \( \alpha \). Read the problem for the stated significance level. Default to \( 0.05 \) if not given.
2
Locate the p-value. From a calculator, table, or the problem statement.
3
Compare. Is the p-value \( \leq \alpha \)? Then reject. Is it \( > \alpha \)? Then fail to reject.
4
Write in context. Reference the population proportion, the claimed value, and the real-world scenario.
5
Double-check. Did you avoid saying "accept \( H_0 \)" or "prove"? Good.

Worked Example: Coin Fairness

A student flips a coin 200 times and gets 115 heads. She tests \( H_0\!: p = 0.50 \) vs. \( H_a\!: p \neq 0.50 \) at \( \alpha = 0.05 \). The computed p-value is 0.034.

α = 0.05 p = 0.034 0 1
\( p < \alpha \)

Worked Example: Voter Support

A pollster claims more than 60% of voters support a policy. In a random sample of 400 voters, 252 support it. Testing \( H_0\!: p = 0.60 \) vs. \( H_a\!: p > 0.60 \) at \( \alpha = 0.05 \), the p-value is 0.110.

α = 0.05 p = 0.110 0 1
\( p > \alpha \)

Worked Example: Defective Parts

A factory claims its defective rate is below 3%. A quality inspector tests \( H_0\!: p = 0.03 \) vs. \( H_a\!: p < 0.03 \) with \( n = 500 \) parts and finds 7 defective. The test yields a p-value of 0.018 at \( \alpha = 0.05 \).

1
Identify: \( \alpha = 0.05 \), p-value \( = 0.018 \)
2
Compare: \( 0.018 \leq 0.05 \) ✓
3
Decision: Reject \( H_0 \)

Type I and Type II Errors

Every decision carries a risk of error. Understanding these errors helps you interpret your conclusion's reliability.

Type I Error
Rejecting \( H_0 \) when it is actually true. Probability = \( \alpha \). "False alarm."
Type II Error
Failing to reject \( H_0 \) when it is actually false. Probability = \( \beta \). "Missed finding."

One-Sided vs. Two-Sided Tests

One-Sided Two-Sided
\( H_a \) \( p > p_0 \) or \( p < p_0 \) \( p \neq p_0 \)
Tail(s) One tail Both tails
Conclusion wording "...greater than" or "...less than" "...different from"
p-value size Smaller (easier to reject) Larger (harder to reject)

Common Mistakes

✕ Saying "Accept \( H_0 \)"
We never "accept" the null. The correct phrase is "fail to reject \( H_0 \)."
✕ Proving \( H_a \)
We never "prove" anything. Say there is "convincing evidence" for \( H_a \), not that it's proven.
✕ No Context
A conclusion without the real-world scenario loses major points on AP exams. Always reference what \( p \) represents.
✕ Wrong Direction
Saying "different from" when \( H_a \) is one-sided, or "greater than" when \( H_a\!: p \neq p_0 \).
✕ Comparing Wrong Values
Comparing the test statistic to \( \alpha \) instead of comparing the p-value to \( \alpha \).

Summary: Conclusion Checklist

Step What to Do Example Phrase
1. State p-value and \( \alpha \) Quote both numerical values "p-value = 0.034, \( \alpha = 0.05 \)"
2. Compare Use \( \leq \) or \( > \) "Since 0.034 \( \leq \) 0.05..."
3. Decision Reject or fail to reject \( H_0 \) "...we reject \( H_0 \)."
4. Context Reference the population and claim "There is convincing evidence that..."

Worked Example: Full Hypothesis Test with Conclusion

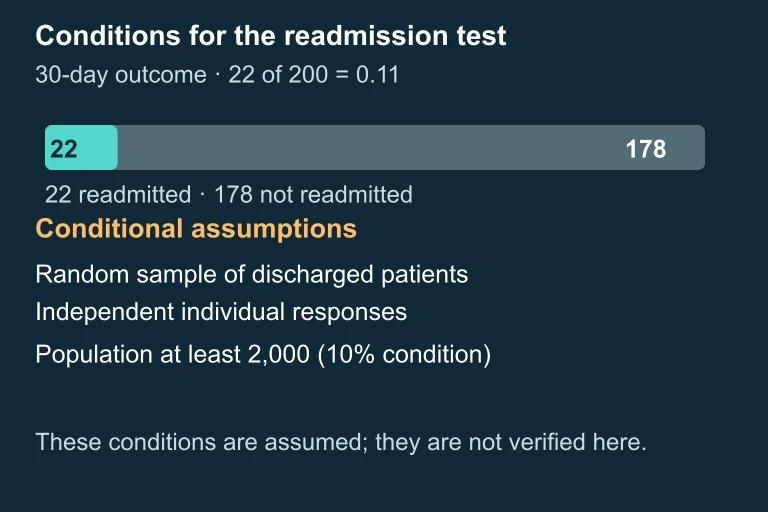
A hospital administrator claims that fewer than 15% of patients discharged from the emergency department are readmitted within 30 days. A random sample of 200 discharged patients reveals that 22 were readmitted. At the α = 0.05 significance level, is there convincing evidence that the readmission rate is less than 15%? One-Proportion z-Test for Hospital Readmission Rate Step 1 — State the Hypotheses Define p as the true proportion of all emergency department patients at this hospital who are readmitted within 30 days. The null hypothesis is H₀: p = 0.15 and the alternative hypothesis is Hₐ: p < 0.15. This is a one-sided (left-tailed) test because the administrator's claim suggests the rate is below 15%. Step 2 — Check Conditions Random: The sample is described as a random sample of 200 discharged patients. ✓ Independence: Assuming the hospital discharges far more than 10 × 200 = 2,000 patients, the 10% condition is met. ✓ Large Counts: np₀ = 200(0.15) = 30 ≥ 10 and n(1 − p₀) = 200(0.85) = 170 ≥ 10, so the normal approximation is appropriate. ✓ Step 3 — Compute the Test Statistic The sample proportion is p̂ = 22/200 = 0.11. The standard error under H₀ is √(0.15 × 0.85 / 200) = √(0.1275 / 200) = √0.0006375 ≈ 0.02525. Therefore, z = (0.11 − 0.15) / 0.02525 = −0.04 / 0.02525 ≈ −1.584. z ≈ −1.584 Step 4 — Find the P-Value Because this is a left-tailed test (Hₐ: p < 0.15), the p-value is P(Z ≤ −1.584). Using a standard normal table or calculator: p-value ≈ 0.0566. p-value ≈ 0.0566 Step 5 — State the Conclusion Because the p-value (0.0566) is greater than α = 0.05, we fail to reject H₀. There is not convincing evidence that the true proportion of emergency department patients at this hospital who are readmitted within 30 days is less than 0.15. Fail to reject H₀ — not convincing evidence that p < 0.15 Why Step 5 Matters Most Notice that the conclusion does not say 'we accept that p = 0.15' or 'the readmission rate is 15%.' It only says we lack convincing evidence that it is lower. The data are consistent with p = 0.15, but also consistent with many other values. This nuanced language is essential and reflects the Neyman–Pearson logic: the test is designed to control the probability of wrongly rejecting H₀, not to confirm it.
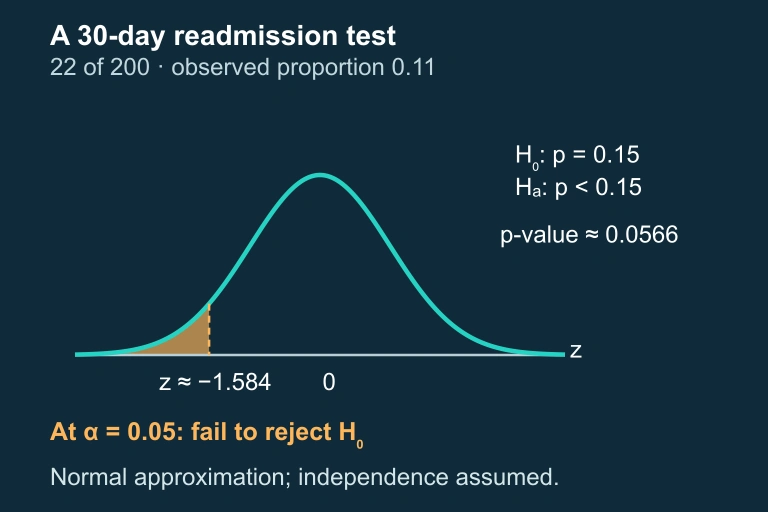
Left-tailed test of a population proportion with z about −1.584 and p-value about 0.0566. At α=0.05, fail to reject H₀:p=0.15.
Population proportion p appears in the hypotheses; the separate p-value is approximately 0.0566.
Partition of 200 patients into 22 readmitted and 178 not readmitted, with the sampling and independence assumptions stated.
Population proportion p appears in the hypotheses; the separate p-value is approximately 0.0566.

Question 1 of 5

A researcher tests \( H_0\!: p = 0.40 \) vs. \( H_a\!: p > 0.40 \) at \( \alpha = 0.05 \) and obtains a p-value of 0.023. What is the correct conclusion?

Question 2 of 5

A test of \( H_0\!: p = 0.75 \) vs. \( H_a\!: p \neq 0.75 \) yields a p-value of 0.08. At \( \alpha = 0.05 \), what should you conclude?

Question 3 of 5

Which of the following is the best conclusion for a test where the p-value is 0.002 and \( \alpha = 0.01 \)?

Question 4 of 5

A student concludes: "We reject \( H_0 \). The true proportion is definitely not 0.50." What is wrong with this conclusion?

Question 5 of 5

When we fail to reject \( H_0 \), which type of error is possible?