Chi-Square Tests
Homogeneity & Independence
Learn how to set up a \(\chi^2\) test: state hypotheses, build two-way tables, compute expected counts, and choose the right test.
What Is a \(\chi^2\) Test?
A chi-square test compares observed counts in categorical data to the counts we would expect if a certain hypothesis were true. The test statistic measures how far the observed data deviates from what we predicted.
In AP Statistics, you encounter three chi-square tests: Goodness-of-Fit, Independence, and Homogeneity. This lesson focuses on setting up the last two.
The Two-Way Table
Both the test for independence and the test for homogeneity rely on a two-way table (contingency table). It cross-classifies individuals by two categorical variables.
Independence vs Homogeneity
Both tests use the same formula and the same mechanics, but they ask different questions about different study designs.
A university population with four visibly different sampling routes
 The way people or groups enter a study determines its design. Sampling within groups, selecting whole groups and assigning treatments answer different questions.
Let the sampling design name the test
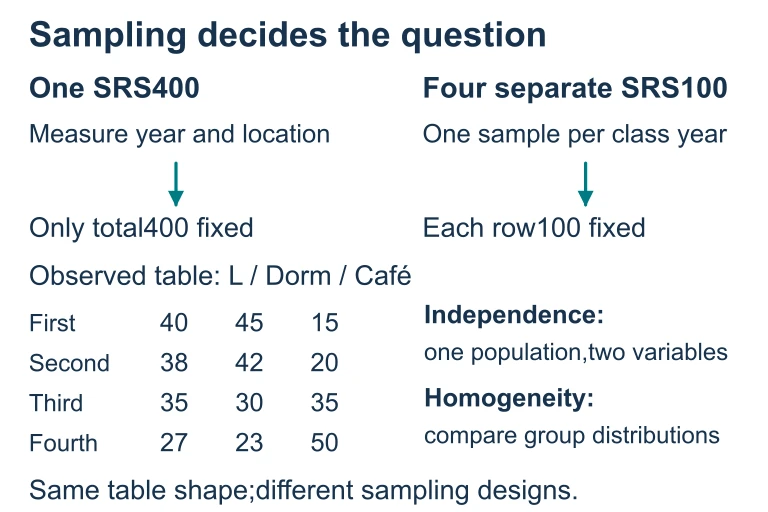 For the displayed 400-student table, expected counts in each row are 35, 35 and 30, and df = (4 − 1)(3 − 1) = 6. One random sample classified twice tests independence; separately sampled class-year groups test homogeneity.
Hypotheses: Independence
When we test for independence, our hypotheses concern the relationship between two categorical variables within a single population.
Hypotheses: Homogeneity
When we test for homogeneity, our hypotheses concern whether distributions are the same across multiple populations or treatments.
Computing Expected Counts
Under \(H_0\), we compute what each cell count should be. The expected count for row \(i\), column \(j\) is:
This formula works identically for both independence and homogeneity tests. It represents the count we would see if the null hypothesis were exactly true.
Checking Conditions
Before performing a \(\chi^2\) test, you must verify three key conditions. The AP exam expects you to name and check each one.
Degrees of Freedom
The \(\chi^2\) distribution is specified by its degrees of freedom. For a two-way table with \(r\) rows and \(c\) columns:
The same formula applies to both independence and homogeneity tests. More degrees of freedom means the \(\chi^2\) distribution is shifted to the right.
The \(\chi^2\) Distribution
Step-by-Step Setup
Example 1: Independence
A researcher randomly selects 200 adults and classifies each by exercise frequency (Low, Medium, High) and health status (Good, Poor). Is there an association?
| Good | Poor | Total | |
|---|---|---|---|
| Low | 20 | 30 | 50 |
| Medium | 45 | 35 | 80 |
| High | 55 | 15 | 70 |
| Total | 120 | 80 | 200 |
Example 1: Expected Counts
Apply \(E_{ij} = \frac{R_i \times C_j}{n}\) to each cell. For instance, the expected count for (Low, Good):
| Good (Expected) | Poor (Expected) | |
|---|---|---|
| Low | 30 | 20 |
| Medium | 48 | 32 |
| High | 42 | 28 |
Example 2: Homogeneity
A school district surveys 150 students from School A and 150 students from School B about their preferred lunch option: Pizza, Salad, or Sandwich.
| Pizza | Salad | Sandwich | Total | |
|---|---|---|---|---|
| School A | 70 | 40 | 40 | 150 |
| School B | 50 | 60 | 40 | 150 |
| Total | 120 | 100 | 80 | 300 |
Common Mistakes
Summary Comparison
| Feature | Independence | Homogeneity |
|---|---|---|
| Sampling | One random sample | Separate samples per population |
| Variables | Two categorical variables | One categorical variable |
| \(H_0\) | Variables are independent | Distributions are the same |
| Fixed totals | Only grand total \(n\) | Row (or column) totals fixed |
| Expected count formula | \(\frac{R_i \times C_j}{n}\) | \(\frac{R_i \times C_j}{n}\) |
| df | \((r-1)(c-1)\) | \((r-1)(c-1)\) |
| Test statistic | \(\chi^2 = \displaystyle\sum\frac{(O-E)^2}{E}\) | \(\chi^2 = \displaystyle\sum\frac{(O-E)^2}{E}\) |
Question 1 of 5
A researcher randomly surveys 500 voters and records each person's political party and stance on an issue (Support, Oppose, Neutral). Which test should be used?
Question 2 of 5
In a \(3 \times 4\) two-way table, what are the degrees of freedom for the \(\chi^2\) test?
Question 3 of 5
A two-way table has a row total of 60, a column total of 80, and a grand total of 200. What is the expected count for that cell?
Question 4 of 5
Which condition for a \(\chi^2\) test requires that all expected counts be at least 5?
Question 5 of 5
A study independently samples 100 freshmen and 100 seniors, then asks each student to name their preferred social media platform. The appropriate null hypothesis is: