

SECTION 1
Historical Context & Motivation
Many real-world situations share a simple but compelling structure: you repeat an experiment under identical conditions until a particular event occurs for the first time. A quality-control inspector tests lightbulbs until one fails, a basketball player shoots free throws until she makes one, or a geneticist breeds organisms until a recessive phenotype appears. The geometric distribution provides the probabilistic framework for all such 'waiting-time' scenarios, formalizing the question: How many trials will it take to get the first success?
The intellectual roots of this distribution lie in the broader development of probability theory during the seventeenth and eighteenth centuries. As mathematicians studied games of chance and actuarial problems, they naturally encountered sequences of independent trials with two possible outcomes—what we now call Bernoulli trials. The geometric distribution emerged as one of the simplest and most elegant consequences of this framework, connecting combinatorial reasoning with the geometric series from which it derives its name.
1654 • The Pascal–Fermat Correspondence
1713 • Ars Conjectandi Published
1837 • Poisson's Systematic Framework
20th c. • Modern Textbook Formalization
The central question the geometric distribution addresses is deceptively straightforward: given a fixed probability of success on each trial, what is the probability that the first success occurs on the kth trial? Answering this question rigorously requires only the multiplication rule for independent events and the formula for a geometric series, yet the resulting distribution is remarkably powerful—appearing in quality control, genetics, telecommunications, and game theory alike.
SECTION 2
Core Principles & Definitions
Before working with the geometric distribution, you must verify that the scenario satisfies a specific set of conditions. These conditions mirror those of the binomial setting, with one critical modification: instead of a fixed number of trials, the random variable counts the number of trials required to achieve the first success. If any of the conditions below fails, the geometric model does not apply.
Binary Outcomes
Independence
Constant Probability
Counting to the First Success
Notice how these conditions differ from the binomial setting. In a binomial experiment the number of trials n is fixed in advance and the random variable counts the total number of successes. In the geometric setting, success is guaranteed to happen eventually—we simply do not know when. This subtle shift from 'how many successes in n trials' to 'how many trials until the first success' is the defining hallmark of the geometric distribution.
KEY TAKEAWAY
SECTION 3
Visual Explanation
The probability distribution of a geometric random variable has a distinctive shape: it starts at its maximum value when X = 1 and decays exponentially as X increases. The following diagram shows the probability mass function (PMF) for a geometric distribution with p = 0.3, illustrating how the probability of achieving the first success on later and later trials diminishes in a characteristic staircase pattern.
Several features are worth observing. First, the distribution is right-skewed—the long tail stretches toward larger values of k, indicating that while most first successes occur relatively early, there is always a nonzero probability of having to wait a very long time. Second, the bars form a geometric sequence with common ratio (1 − p), which is precisely why this is called the geometric distribution. Third, the sum of all bar heights equals 1, confirming that this is a valid probability distribution—a fact guaranteed by the geometric series formula.
 Collecting all prize types and waiting for the first designated prize use different stopping rules. Define the response variable before generating trials.
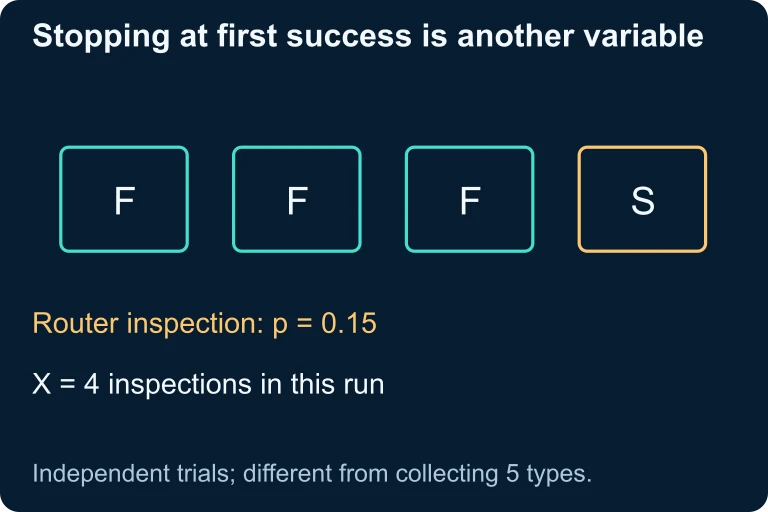 In a separate router example, each independent trial succeeds with probability 0.15. The sequence failure, failure, failure, success gives X = 4, with probability 0.85³ × 0.15. This stopping rule differs from collecting all five cereal-prize types.
SECTION 4
Mathematical Framework
Deriving the probability mass function requires only the multiplication rule for independent events. If the first success occurs on trial k, then the preceding (k − 1) trials must all have been failures and the kth trial must be a success. Since the trials are independent with constant probabilities, we multiply:
PROBABILITY MASS FUNCTION
Here p is the probability of success on each trial, k is the trial number on which the first success occurs, and (1 − p) is the probability of failure. The exponent (k − 1) counts the failures before the first success.
We can verify that these probabilities sum to 1 by recognizing the infinite geometric series: Σ (1 − p)k−1 × p from k = 1 to ∞ equals p × [1 / (1 − (1 − p))] = p × (1/p) = 1. The expected value and variance can be derived using similar series manipulations or moment-generating function techniques.
EXPECTED VALUE (MEAN)
The mean tells you the average number of trials needed to get the first success. For example, if p = 0.2 (a 20% chance each trial), you expect on average 1/0.2 = 5 trials.
VARIANCE AND STANDARD DEVIATION
The variance measures how spread out the waiting times are. As p decreases, both the mean and the variance increase—low-probability events require more trials on average and exhibit greater variability in timing.
A particularly useful formula for AP Statistics involves cumulative probabilities. The probability that the first success occurs on or before trial k (equivalently, the probability that you need at most k trials) is given by:
CUMULATIVE PROBABILITY
This formula is derived from the complement rule: P(X ≤ k) = 1 − P(X > k). The event X > k means all k trials were failures, which has probability (1 − p)k. This shortcut avoids the need to sum individual PMF values.
SECTION 5
Key Properties & the Memoryless Property
The geometric distribution possesses a remarkable and unique property among discrete distributions: the memoryless property. In precise terms, if X is geometric, then P(X > s + t | X > s) = P(X > t) for all positive integers s and t. Intuitively, this means that if you have already failed on the first s trials, the probability of needing at least t more trials is the same as if you were starting fresh. The past failures give you no information about how much longer you will have to wait. The geometric distribution is the only discrete distribution with this property.
On the AP Statistics exam, the memoryless property is occasionally tested directly, but more frequently it appears implicitly in questions that ask for conditional probabilities. For instance, 'Given that a basketball player has missed his first three free throws, what is the probability he will need more than two additional attempts to make one?' If the geometric conditions hold, the answer is simply P(X > 2) = (1 − p)², computed as though the first three misses never happened.
AP EXAM TIP
SECTION 6
Worked Example
A consumer electronics company knows from historical data that 15% of its wireless routers fail the final quality inspection. An inspector tests routers one at a time, and we define 'success' as finding a defective router. We want to answer several questions about this geometric setting.
Quality Inspection — Geometric Distribution
- 1
Step 1 — Verify the Geometric Conditions
Each inspection has two outcomes (defective or not), inspections are independent of one another, the probability of finding a defective router is constant at p = 0.15, and the inspector continues until the first defective router is found. All four conditions are satisfied, so X ~ Geometric(p = 0.15). - 2
Step 2 — Find P(X = 4)
We want the probability that the first defective router is found on the 4th inspection. Using the PMF: P(X = 4) = (1 − 0.15)3 × 0.15 = (0.85)3 × 0.15 = 0.614125 × 0.15.P(X = 4) ≈ 0.0921 - 3
Step 3 — Find P(X ≤ 5)
We want the probability that the first defective router is found within the first 5 inspections. Using the CDF shortcut: P(X ≤ 5) = 1 − (1 − 0.15)5 = 1 − (0.85)5 = 1 − 0.4437 ≈ 0.5563.P(X ≤ 5) ≈ 0.5563 - 4
Step 4 — Find the Expected Value and Standard Deviation
The mean number of inspections until finding the first defective router is μ = 1/p = 1/0.15 ≈ 6.667. The standard deviation is σ = √[(1 − p)/p²] = √[0.85/0.0225] = √37.778 ≈ 6.147. The large standard deviation relative to the mean reflects the heavy right skew of the distribution.μ ≈ 6.67 inspections, σ ≈ 6.15 inspections - 5
Step 5 — Interpret in Context
On average, the inspector must test about 6 or 7 routers before finding the first defective one. There is roughly a 55.6% chance that a defective router will appear within the first 5 tests, and about a 9.2% chance that the 4th router tested is the first defective one. The relatively large standard deviation tells us that the actual number of inspections can vary substantially from the mean.
SECTION 7
Geometric vs. Binomial: Strengths & Limitations
Students often confuse the geometric and binomial distributions because both arise from independent Bernoulli trials with constant probability p. The critical distinction lies in what is fixed and what is random. Understanding this comparison is essential for the AP exam, where you must identify the correct distribution before performing any calculation.
| Feature | Binomial Distribution | Geometric Distribution |
|---|---|---|
| What is fixed? | Number of trials n | Nothing—trials continue until first success |
| Random variable counts | Number of successes in n trials | Number of trials until first success |
| Possible values | 0, 1, 2, …, n (finite) | 1, 2, 3, … (infinite) |
| Mean | np | 1/p |
| Variance | np(1 − p) | (1 − p)/p² |
| Shape | Approximately symmetric when np ≥ 10 and n(1−p) ≥ 10 | Always right-skewed |
| Memoryless? | No | Yes |
Side-by-side comparison of the binomial and geometric distributions
KEY TAKEAWAY
It is also important to recognize the limitations of the geometric model. In practice, trials may not be perfectly independent (for example, a student's confidence may change after several failures), or the probability may shift over time (a machine's defect rate may increase as it wears). When these violations are mild, the geometric distribution remains a useful approximation; when they are severe, more sophisticated models such as the negative binomial or Markov-chain-based waiting-time distributions may be required.
SECTION 8
Connection to Advanced Theory
The geometric distribution is the simplest case of a broader family of distributions that model waiting times in sequences of Bernoulli trials. Understanding how it fits into this larger framework will deepen your understanding and prepare you for topics beyond the AP exam.
| Feature | Geometric Distribution | Negative Binomial Distribution |
|---|---|---|
| What it counts | Trials until the 1st success | Trials until the rth success |
| Parameters | p only | r and p |
| Mean | 1/p | r/p |
| Relationship | Special case where r = 1 | Sum of r independent Geometric(p) random variables |
| Memoryless? | Yes | No (for r > 1) |
The geometric distribution as a special case of the negative binomial
There is also a continuous analogue: the exponential distribution models the waiting time until the first event in a continuous-time Poisson process, and it too is memoryless. Just as the geometric distribution is the only discrete memoryless distribution, the exponential distribution is the only continuous memoryless distribution. If you continue into college probability courses, you will see that these two distributions are deeply connected through the relationship between discrete and continuous stochastic processes.
LOOKING AHEAD
SECTION 9
Practice Problems
Question 1: CONCEPTUAL
- A. Counting the number of heads in 20 flips of a fair coin
- B. Counting how many times a six-sided die is rolled until a 3 appears for the first time
- C. Recording the heights of 50 randomly selected students
- D. Counting the total number of defective items in a shipment of 500
- E. Drawing cards from a deck without replacement until an ace is drawn
Show answer (B)
Question 2: BASIC CALCULATION
- A. 0.064
- B. 0.096
- C. 0.144
- D. 0.216
- E. 0.360
Show answer (C)
Question 3: INTERMEDIATE
- A. 0.2373
- B. 0.6328
- C. 0.7627
- D. 0.7500
- E. 0.9990
Show answer (C)
Question 4: APPLIED
4 ptsShow answer
Question 5: CRITICAL THINKING
4 ptsShow answer
SUMMARY
Summary
Summary
The geometric distribution models the number of independent Bernoulli trials needed to achieve the first success, where each trial has a constant probability of success p. Its probability mass function is P(X = k) = (1 − p)k−1 × p for k = 1, 2, 3, …, producing a right-skewed distribution whose probabilities decay by the constant factor (1 − p) at each step.
The expected value is μ = 1/p and the variance is σ² = (1 − p)/p². The cumulative probability shortcut P(X ≤ k) = 1 − (1 − p)k eliminates the need to sum individual PMF values. The memoryless property—unique among discrete distributions—states that past failures do not change future probabilities: P(X > s + t | X > s) = P(X > t). For the AP exam, be sure to distinguish the geometric distribution from the binomial distribution by asking whether the number of trials is fixed in advance (binomial) or determined by when the first success occurs (geometric).