

SECTION 1
Historical Context & Motivation
The Central Limit Theorem (CLT) stands as one of the most profound results in all of probability and statistics, providing the theoretical foundation for virtually every confidence interval and hypothesis test you will encounter on the AP Statistics exam. The theorem answers a deceptively simple question: if you repeatedly draw random samples from any population and compute their means, what shape will the distribution of those means take? Before the CLT was formalized, mathematicians had noticed that averages of measurements—even from wildly skewed or irregular distributions—seemed to cluster around the population mean in a bell-shaped pattern. The quest to understand and prove this empirical observation spanned more than two centuries of mathematical development.
1733 • De Moivre's Approximation
1812 • Laplace's Generalization
1901 • Lyapunov's Rigorous Proof
1920s • Lindeberg–Lévy Refinement
The central question that drove this entire line of inquiry was both practical and elegant: Why does the normal distribution appear so pervasively in real-world data? Heights, test scores, measurement errors, and countless other phenomena are approximately normal—not because nature prefers bell curves, but because many observed quantities are effectively averages or sums of many small, independent influences. The CLT explains this universality and, critically for AP Statistics, it justifies using normal-based inference procedures even when the underlying population is not normally distributed.
SECTION 2
Core Principles & Definitions
Before stating the theorem formally, it is essential to distinguish between two related but distinct concepts. A population distribution describes the values of every individual in the population—it can be any shape at all: skewed, bimodal, uniform, or already normal. A sampling distribution describes the behavior of a statistic (such as the sample mean x̄) computed across all possible random samples of a fixed size n. The CLT speaks exclusively about this second distribution—the sampling distribution of x̄—and asserts that it becomes approximately normal for sufficiently large n, regardless of the population's shape.
Shape Convergence
Center Preservation
Spread Reduction
Independence Requirement
Sample Size Threshold
KEY TAKEAWAY
SECTION 3
Visual Explanation
The most powerful way to internalize the CLT is to watch it in action. The diagram below shows three different population distributions—a strongly right-skewed exponential, a uniform, and a bimodal distribution—alongside the sampling distributions of x̄ that emerge at sample sizes n = 2, n = 10, and n = 30. Notice how even the most irregular population shape yields a nearly perfect bell curve by n = 30.
Several features of the diagram are worth emphasizing. In the top row, the exponential population is heavily right-skewed, yet by n = 30 the sampling distribution of x̄ is nearly symmetric. The uniform population (middle row) converges even faster—a triangular shape appears by n = 2, and near-normality is reached around n = 10. The bimodal population (bottom row) is the most stubborn, retaining a slight flattening at small sample sizes, but it too yields a convincing bell curve by n = 30. This visual pattern is exactly what the AP exam expects you to understand: the more the population departs from normality, the larger the sample size needed for the CLT to produce a good approximation.
 A tray contains individual observations, but its average contributes one value to a distribution of sample means. Repeating the sampling process reveals how that statistic varies.
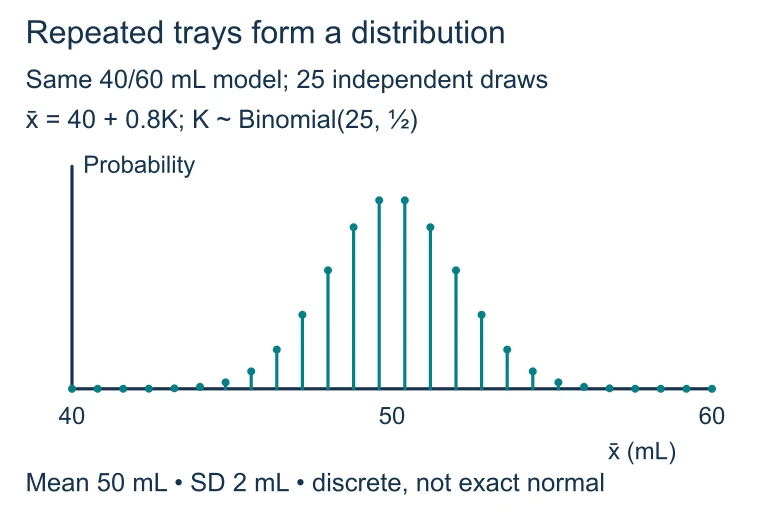 For 25 independent fills equally likely to be 40 or 60 mL, K is binomial with n = 25 and p = 0.5, and the tray mean is 40 + 0.8K. The exact distribution is discrete, centered at 50 mL with standard deviation 2 mL. A normal curve approximates its shape.
SECTION 4
Mathematical Framework
The CLT can be stated concisely using formal notation. Let X₁, X₂, …, Xₙ be independent random variables drawn from a population with mean μ and finite standard deviation σ. Define the sample mean as x̄ = (X₁ + X₂ + … + Xₙ) / n. Then as n → ∞, the standardized variable Z = (x̄ − μ) / (σ / √n) converges in distribution to the standard normal N(0, 1). For practical purposes on the AP exam, you need the following equations.
MEAN OF THE SAMPLING DISTRIBUTION
The mean of the sampling distribution of x̄ equals the population mean μ. This holds for any sample size, not just large ones, and is why x̄ is called an unbiased estimator.
STANDARD DEVIATION OF THE SAMPLING DISTRIBUTION
Often called the standard error of the mean. As n increases, σ_x̄ decreases by a factor of √n, meaning quadrupling the sample size halves the standard error.
CLT APPROXIMATION
This is the complete CLT statement: the sampling distribution of x̄ is approximately normal with center μ and spread σ / √n. On the AP exam, 'sufficiently large' typically means n ≥ 30 unless the population is already normal.
STANDARDIZATION (Z-SCORE FOR x̄)
This z-score measures how many standard errors a particular sample mean x̄ falls from the population mean μ. Use this to find probabilities involving x̄ from the standard normal table or your calculator's normalcdf function.
AP Exam Tip
SECTION 5
Conditions & Sample Size Guidelines
Applying the CLT correctly on the AP exam requires you to verify specific conditions before concluding that the sampling distribution is approximately normal. Free-response graders look for explicit statements of these conditions, so understanding them in detail is essential for earning full credit.
| Population Shape | Minimum n for CLT | Reasoning |
|---|---|---|
| Normal | Any n | x̄ is exactly normal when the population is normal |
| Symmetric, non-normal (e.g., uniform) | n ≥ 15 | Symmetry means convergence is rapid |
| Moderately skewed | n ≥ 30 | The standard AP guideline for most non-normal populations |
| Heavily skewed or outlier-prone | n ≥ 40–50+ | Extreme skew (e.g., income data) needs larger samples |
Sample size guidelines for CLT approximation by population shape
The 10% Condition
SECTION 6
Worked Example
A bottling machine fills soda cans with a mean fill volume of μ = 355 mL and a standard deviation of σ = 4 mL. The distribution of individual fill volumes is right-skewed. A quality control inspector selects a random sample of 50 cans. What is the probability that the sample mean fill volume is less than 354 mL?
Finding P(x̄ < 354) Using the CLT
- 1
Step 1 — Check Conditions
Independence: The 50 cans are randomly selected, and 50 is certainly less than 10% of all cans the machine produces (tens of thousands daily), so the independence condition is satisfied. Normality: Although the population is right-skewed, n = 50 ≥ 30, so by the CLT the sampling distribution of x̄ is approximately normal. - 2
Step 2 — Identify Parameters of the Sampling Distribution
μ_x̄ = μ = 355 mL. The standard error is σ_x̄ = σ / √n = 4 / √50 = 4 / 7.071.σ_x̄ ≈ 0.5657 mL - 3
Step 3 — Compute the z-Score
z = (x̄ − μ) / (σ / √n) = (354 − 355) / 0.5657 = −1 / 0.5657.z ≈ −1.768 - 4
Step 4 — Find the Probability
Using the standard normal table or calculator: P(Z < −1.768). On a TI-84, enter normalcdf(−1E99, −1.768, 0, 1).P(x̄ < 354) ≈ 0.0385 - 5
Step 5 — Interpret in Context
There is approximately a 3.85% probability that a random sample of 50 cans will have a mean fill volume below 354 mL. This is a relatively unlikely outcome if the machine is operating correctly, which is why quality control inspectors might flag such a result as evidence of under-filling.
SECTION 7
Strengths, Limitations & Common Misconceptions
| Strengths | Limitations |
|---|---|
| Applies regardless of population shape, making normal-based inference widely usable | Requires a sufficiently large n; for heavily skewed populations, n = 30 may not be enough |
| Provides a simple, closed-form approximation (normal distribution) rather than requiring simulation | Assumes finite variance; fails for distributions with infinite variance (e.g., Cauchy) |
| Underpins z-tests, t-tests, confidence intervals, and regression inference | Approximation quality is hard to gauge exactly without simulation or Berry–Esseen bounds |
| Sample means become more precise as n grows (σ_x̄ → 0) | Does not apply to statistics other than means/sums without additional justification |
Strengths and limitations of the Central Limit Theorem
Common Misconceptions on the AP Exam
- "The CLT says the data become normal." Incorrect. The individual data values retain the population's shape. The CLT applies only to the sampling distribution of the sample mean (or sum), not to individual observations.
- "n ≥ 30 is always required." Incorrect. If the population is already approximately normal, any sample size is sufficient. The n ≥ 30 rule is a guideline for non-normal populations.
- "The CLT applies to any statistic." Not automatically. The CLT specifically addresses means and sums. While the sampling distribution of a proportion is also approximately normal (by a related argument), statistics like the median or range require different theory.
- "The standard deviation of x̄ is σ." The standard deviation of x̄ is σ / √n, not σ. Forgetting the √n in the denominator is one of the most common calculation errors.
KEY TAKEAWAY
SECTION 8
Connection to Inference & Advanced Theory
The CLT is not merely an abstract theorem—it is the engine that powers the inferential procedures you use throughout the AP Statistics course. Every time you construct a confidence interval for a mean or conduct a hypothesis test about a mean, you are implicitly relying on the CLT's guarantee that x̄ is approximately normally distributed. The table below highlights how the CLT connects to its more advanced counterpart when the population standard deviation σ is unknown.
| Feature | CLT with Known σ (z-procedures) | Unknown σ (t-procedures) |
|---|---|---|
| Standard error formula | σ / √n (population σ known) | s / √n (sample s replaces σ) |
| Reference distribution | Standard normal N(0, 1) | t-distribution with df = n − 1 |
| Tails | Thinner tails | Heavier tails (more conservative) |
| Convergence as n → ∞ | Already N(0, 1) | t → N(0, 1) as df → ∞ |
| Typical AP exam usage | Rarely tested (σ seldom known in practice) | Primary tool for inference about means |
Comparison of z-based and t-based inference for means
Beyond the AP curriculum, the CLT extends in several powerful directions. The multivariate CLT shows that vectors of sample means converge to a multivariate normal distribution, which underpins multiple regression theory. The Berry–Esseen theorem quantifies the rate of convergence, giving an upper bound on the approximation error that decreases at rate 1/√n. In Bayesian statistics, the CLT justifies the use of normal approximations to posterior distributions in large samples. These extensions illustrate that the CLT is not merely a stepping stone—it is a central pillar of statistical theory at every level.
SECTION 9
Practice Problems
Question 1: CONCEPTUAL
- A. It is strongly right-skewed because the population is strongly right-skewed.
- B. It is approximately normal with mean μ and standard deviation σ.
- C. It is approximately normal with mean μ and standard deviation σ / √100.
- D. It is exactly normal with mean μ and standard deviation σ / √100.
- E. The shape cannot be determined without knowing the exact population distribution.
Show answer (C)
Question 2: BASIC CALCULATION
- A. 0.083 pounds
- B. 0.25 pounds
- C. 0.50 pounds
- D. 2.00 pounds
- E. 3.00 pounds
Show answer (C)
Question 3: INTERMEDIATE
- A. 0.0082
- B. 0.0446
- C. 0.0918
- D. 0.4338
- E. 0.5662
Show answer (C)
Question 4: APPLIED
4 ptsShow answer
Question 5: CRITICAL THINKING
4 ptsShow answer
SUMMARY
Summary
Summary
The Central Limit Theorem states that the sampling distribution of the sample mean x̄ is approximately normal for sufficiently large sample sizes, regardless of the population's shape. The center of this distribution is the population mean μ, and its spread is measured by the standard error σ / √n, which decreases as the sample size grows. Before applying the CLT on the AP exam, you must verify two conditions: independence (random sampling and the 10% condition) and sample size adequacy (generally n ≥ 30 for non-normal populations, though symmetric populations converge faster and normal populations need no minimum n).
The CLT is the theoretical backbone of confidence intervals and hypothesis tests for means. Remember: the theorem describes the behavior of sample means, not individual data values. The z-score formula z = (x̄ − μ) / (σ / √n) converts any sample mean to the standard normal scale, enabling probability calculations. Master the conditions, the formulas, and the interpretation, and you will be well-prepared for any CLT question on the AP Statistics exam.