

SECTION 1
Historical Context & Motivation
Long before the formal discipline of statistics existed, scholars and administrators grappled with a fundamental challenge: how to distill large collections of numerical observations into compact, meaningful descriptions. Census records from ancient civilizations already demanded some notion of a typical value — a single number that could stand in for an entire population. The intellectual journey from ad hoc averaging to a rigorous framework of summary statistics spans centuries of mathematical innovation and reflects a growing awareness that data, by themselves, do not speak; they must be summarized and interpreted.
1670s • The Arithmetic Mean Gains Traction
1817 • Median Emerges as a Robust Alternative
1893 • Karl Pearson and Standard Deviation
1977 • John Tukey's Five-Number Summary
The central question that unites this history is deceptively simple: How can we describe the center, spread, and shape of a quantitative distribution using just a few numbers? The answer depends on which features of the data you wish to emphasize and how sensitive you want your summary to be to unusual observations. Mastering these choices is essential for the AP Statistics exam and for any data-driven reasoning beyond it.
SECTION 2
Core Principles & Definitions
Summary statistics organize into three broad categories — measures of center, measures of spread, and measures of position — that collectively characterize the distribution of a quantitative variable. Understanding the properties of each statistic, especially its sensitivity to outliers, determines when it is the appropriate choice for describing a data set.
Measures of Center
Measures of Spread
Measures of Position
Resistance
KEY TAKEAWAY
SECTION 3
Visualizing Summary Statistics on a Distribution
The following diagram overlays key summary statistics on a right-skewed distribution, illustrating where the mean, median, quartiles, and standard deviation benchmarks fall relative to the data. Notice how skewness pulls the mean toward the tail while the median remains anchored near the bulk of the data.
When a distribution is approximately symmetric and unimodal, the mean and median nearly coincide, and the standard deviation paired with the mean provides an efficient two-number summary. For skewed data or data with outliers, the median and IQR pair is preferred because both statistics are resistant — their values change only slightly when extreme observations are added or removed. The AP exam frequently tests whether students can justify their choice of summary statistics based on the shape of a distribution.
SECTION 4
Mathematical Framework
The formulas below apply to a sample of n observations denoted x₁, x₂, …, xₙ. On the AP Statistics exam you will use your calculator for computation, but understanding the structure of each formula is essential for interpreting output and answering conceptual questions.
SAMPLE MEAN
x̄ (read "x-bar") is the sum of all observations divided by the count. It is the balance point of the distribution: the sum of deviations from x̄ is always zero.
SAMPLE STANDARD DEVIATION
The quantity (xᵢ − x̄) is the deviation of the i-th observation from the mean. Squaring ensures negative and positive deviations don't cancel. We divide by (n − 1) rather than n to obtain an unbiased estimator of the population variance σ². Taking the square root returns the result to the original units of measurement.
INTERQUARTILE RANGE
Q₁ is the median of the lower half of the sorted data and Q₃ is the median of the upper half. The IQR measures the spread of the middle 50% and is unaffected by outliers.
RANGE
The simplest measure of spread; it depends only on the two most extreme observations and is therefore the least resistant statistic.
Why n − 1?
SECTION 5
The Five-Number Summary & Box Plot
The five-number summary consists of the minimum, Q₁, median, Q₃, and maximum. Together these five values partition the data into four segments, each containing roughly 25% of the observations. A box plot (or box-and-whisker plot) is the graphical representation of the five-number summary, often augmented with an outlier rule: any observation more than 1.5 × IQR below Q₁ or above Q₃ is flagged as a potential outlier and plotted individually.
The box plot is an invaluable tool for quickly assessing the symmetry and spread of a distribution. If the median line sits roughly in the center of the box and the whiskers are approximately equal in length, the distribution is roughly symmetric. A median line closer to Q₁ with a longer right whisker signals right skewness, while the reverse indicates left skewness. On the AP exam, you may be asked to compare two or more distributions by placing their box plots side by side on the same axis — focus on comparing center, spread, and shape in your response.
SECTION 6
Worked Example
A researcher records the number of hours 9 college students spent studying during the week before a midterm exam: 4, 7, 8, 10, 11, 12, 14, 15, 35. Compute the mean, median, standard deviation, IQR, and identify any outliers using the 1.5 × IQR rule. Then explain which pair of summary statistics (mean/s or median/IQR) is more appropriate.
Computing Summary Statistics for Study Hours
- 1
Step 1 — Order the Data and Find n
The data are already sorted: 4, 7, 8, 10, 11, 12, 14, 15, 35. Here n = 9. - 2
Step 2 — Compute the Mean
x̄ = (4 + 7 + 8 + 10 + 11 + 12 + 14 + 15 + 35) / 9 = 116 / 9 ≈ 12.89 hours.x̄ ≈ 12.89 hours - 3
Step 3 — Find the Median
With n = 9 observations, the median is the (9 + 1)/2 = 5th value in the ordered list. Counting: 4, 7, 8, 10, 11, 12, 14, 15, 35.Median = 11 hours - 4
Step 4 — Find Q₁ and Q₃
Lower half (below the median): 4, 7, 8, 10. Q₁ = median of lower half = (7 + 8)/2 = 7.5. Upper half (above the median): 12, 14, 15, 35. Q₃ = median of upper half = (14 + 15)/2 = 14.5.Q₁ = 7.5, Q₃ = 14.5, IQR = 7 - 5
Step 5 — Check for Outliers (1.5 × IQR Rule)
Lower fence = Q₁ − 1.5 × IQR = 7.5 − 10.5 = −3. Upper fence = Q₃ + 1.5 × IQR = 14.5 + 10.5 = 25. The observation 35 exceeds the upper fence of 25, so it is flagged as an outlier.35 is an outlier - 6
Step 6 — Compute the Standard Deviation
Compute each squared deviation from x̄ ≈ 12.89: (4 − 12.89)² ≈ 79.03, (7 − 12.89)² ≈ 34.63, (8 − 12.89)² ≈ 23.88, (10 − 12.89)² ≈ 8.35, (11 − 12.89)² ≈ 3.56, (12 − 12.89)² ≈ 0.79, (14 − 12.89)² ≈ 1.23, (15 − 12.89)² ≈ 4.45, (35 − 12.89)² ≈ 488.85. Sum ≈ 644.77. s = √(644.77 / 8) = √80.60 ≈ 8.98.s ≈ 8.98 hours - 7
Step 7 — Choose the Appropriate Summary
Because the distribution contains a high outlier (35 hours), it is right-skewed. The mean (12.89) is pulled above the median (11), and the standard deviation (8.98) is inflated by the outlier. The more appropriate summary uses the median and IQR: "The typical student studied about 11 hours, with the middle 50% studying between 7.5 and 14.5 hours (IQR = 7)."
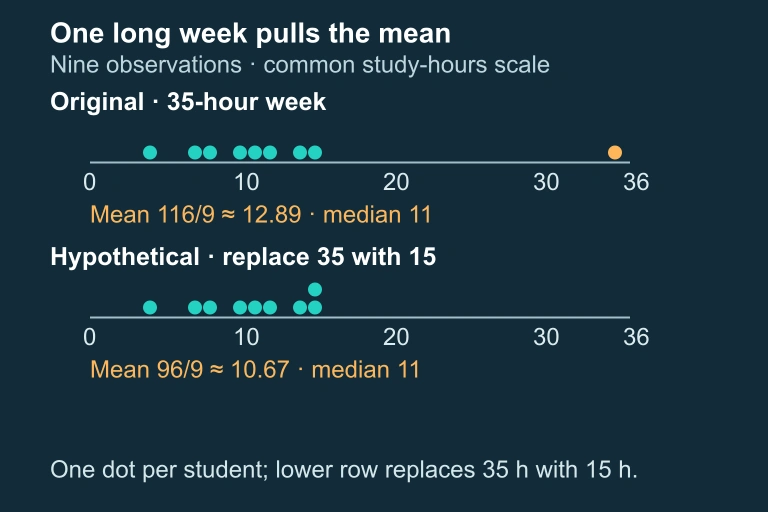 One dot represents one student. The lower row is a hypothetical replacement of 35 study hours by 15 hours.
SECTION 7
Comparing Mean/SD versus Median/IQR
On the AP exam, the choice between reporting the mean and standard deviation or the median and IQR must be justified by the distribution's shape and the presence of outliers. The table below highlights the key properties of each pair.
| Property | Mean & SD | Median & IQR |
|---|---|---|
| Resistance to outliers | Not resistant — extreme values pull both x̄ and s | Resistant — based on ordered positions, not magnitudes |
| Best for which distributions? | Roughly symmetric, no strong outliers | Skewed distributions or those with outliers |
| Uses all data values? | Yes — every observation contributes to x̄ and s | No — depends on rank positions, not exact values |
| Algebraic properties | Deviations from x̄ sum to zero; used in inference formulas | No simple algebraic identity; primarily descriptive |
| Effect of adding a constant c | x̄ shifts by c; s unchanged | Median shifts by c; IQR unchanged |
| Effect of multiplying by k > 0 | x̄ multiplied by k; s multiplied by k | Median multiplied by k; IQR multiplied by k |
Comparison of the two main pairs of summary statistics
KEY TAKEAWAY
SECTION 8
Connections to Inference and Advanced Topics
Summary statistics are not merely descriptive — they form the building blocks of statistical inference. The sample mean x̄ and sample standard deviation s reappear throughout the course as inputs to confidence intervals and hypothesis tests. Understanding how these statistics behave across repeated samples leads directly to the concept of sampling distributions and the Central Limit Theorem.
| Descriptive Concept | Inferential Extension |
|---|---|
| Sample mean x̄ | Point estimator for the population mean μ; appears in one-sample t-tests and t-intervals |
| Sample standard deviation s | Estimates σ; used to compute the standard error of x̄: SE = s / √n |
| Shape assessment (skewness, outliers) | Determines whether Normal-based procedures are appropriate or whether the sample size is large enough for CLT to apply |
| Transforming data (adding/multiplying) | Combining random variables: E(X + Y) = E(X) + E(Y); Var(aX + b) = a²Var(X) |
From descriptive statistics to inferential reasoning
When you encounter later topics like z-scores (measuring how many standard deviations a value lies from the mean) or the empirical rule (approximately 68-95-99.7% of data within 1-2-3 standard deviations for Normal distributions), remember that they rest on the summary statistics you learn here. A firm grasp of center and spread — and when each measure is appropriate — will pay dividends throughout every unit of the AP Statistics curriculum.
SECTION 9
Practice Problems
Question 1: CONCEPTUAL
- A. The mean is less than the median because the skew pulls the mean toward lower values.
- B. The mean equals the median because both measure the center of the distribution.
- C. The mean is greater than the median because the long right tail pulls the mean toward higher values.
- D. The mean is greater than the median because the median is always smaller than the mean for any distribution.
- E. The relationship cannot be determined without knowing the exact data values.
Show answer (C)
Question 2: BASIC CALCULATION
- A. IQR = 15; 60 is not an outlier because it is within 1.5 × IQR of the median.
- B. IQR = 15; 60 is an outlier because 60 > Q₃ + 1.5 × IQR = 55.5.
- C. IQR = 35; 60 is not an outlier because the range is only 35.
- D. IQR = 15; 60 is not an outlier because 60 < Q₃ + 1.5 × IQR = 57.
- E. IQR = 7; 60 is an outlier because it exceeds the maximum of 47.
Show answer (B)
Question 3: INTERMEDIATE
- A. New mean = 79; new standard deviation = 13
- B. New mean = 79; new standard deviation = 8
- C. New mean = 74; new standard deviation = 8
- D. New mean = 74; new standard deviation = 13
- E. New mean = 79; new standard deviation = 3
Show answer (B)
Question 4: APPLIED
4 ptsShow answer
Question 5: CRITICAL THINKING
4 ptsShow answer
SUMMARY
Summary
Summary
Summary statistics condense a quantitative distribution into a few interpretable numbers. Measures of center include the mean (the balance point, sensitive to outliers) and the median (the middle value, resistant to outliers). Measures of spread include the standard deviation (average distance from the mean, non-resistant) and the IQR (width of the middle 50%, resistant). The five-number summary (Min, Q₁, Median, Q₃, Max) underlies the box plot and, combined with the 1.5 × IQR rule, identifies potential outliers.
For roughly symmetric distributions without outliers, report the mean and standard deviation. For skewed distributions or those with outliers, report the median and IQR. Adding a constant shifts the center but leaves spread unchanged; multiplying by a positive constant scales both center and spread. These transformation rules extend directly into the study of random variables and inference later in the AP Statistics curriculum.