

SECTION 1
Historical Context & Motivation
Statistical inference for categorical data has a rich history rooted in the need to analyze counts, proportions, and frequency distributions rather than continuous measurements. While methods for quantitative data—such as the t-test and ANOVA—were developed alongside the foundations of parametric statistics, categorical data demanded its own family of techniques. The story of these methods intertwines with the broader evolution of hypothesis testing, from Karl Pearson's pioneering goodness-of-fit statistic to the modern AP Statistics curriculum that asks you to choose among several related procedures.
1900 • Pearson's Chi-Square Statistic
1922 • Fisher's Exact Test & Likelihood Foundations
1934 • Neyman–Pearson Framework
1952 • Extension to r × c Tables
2019 • AP Statistics Curriculum Update
The central challenge in categorical inference has always been the same: given a set of observed counts or proportions and a research question, which statistical procedure yields valid conclusions? This lesson equips you with a systematic decision framework so that on the AP exam—and in applied research—you can identify the correct test within seconds of reading a problem.
SECTION 2
Core Principles & Definitions
Before you can select the right procedure, you must internalize a small set of foundational ideas that differentiate the categorical inference tests on the AP Statistics exam. Each test is tailored to a specific type of research question, number of variables, and number of populations or treatments. Misidentifying any of these features leads to choosing the wrong test and losing credit on both multiple-choice and free-response questions.
One-Sample z-Test for a Proportion
Two-Sample z-Test for a Difference in Proportions
Chi-Square Goodness-of-Fit Test
Chi-Square Test of Homogeneity
Chi-Square Test of Independence
KEY TAKEAWAY
SECTION 3
Visual Decision Flowchart
The flowchart below is your single most powerful tool for selecting the correct categorical inference procedure. Start at the top with the research question and follow the decision nodes downward. Each branch point asks a concrete question about the number of variables, the number of categories, or the number of populations involved. Study this diagram until the pathway becomes automatic.
Notice the critical fork at the top: if only one categorical variable is under study, you proceed down the left branch, where the number of populations and the number of categories guide you to the correct test. If two categorical variables are being examined within a single population, you move to the right branch and land on the chi-square test of independence. The subtlety that most students miss is the distinction between homogeneity and independence: both use the same χ² computation and the same (r − 1)(c − 1) degrees of freedom, but they arise from fundamentally different sampling designs.
SECTION 4
Mathematical Framework
Although the focus of this lesson is on selecting the right procedure rather than computing test statistics, understanding the underlying formulas strengthens your ability to differentiate tests. Each procedure has a characteristic test statistic, degrees of freedom, and set of conditions, and knowing these helps you confirm that your procedural choice matches the problem's structure.
ONE-PROPORTION Z-TEST STATISTIC
where p̂ is the sample proportion, p₀ is the hypothesized population proportion, and n is the sample size. Conditions: np₀ ≥ 10 and n(1 − p₀) ≥ 10; data come from a random sample.
TWO-PROPORTION Z-TEST STATISTIC
where p̂_c = (X₁ + X₂)/(n₁ + n₂) is the pooled proportion under H₀: p₁ = p₂. Conditions: n₁p̂_c ≥ 10, n₁(1 − p̂_c) ≥ 10, and analogously for sample 2; independent random samples or random assignment.
CHI-SQUARE TEST STATISTIC
Used for all three chi-square tests (GOF, homogeneity, independence). The summation extends over all cells. For GOF: df = k − 1 where k is the number of categories. For homogeneity/independence: df = (r − 1)(c − 1). Condition: all expected counts ≥ 5.
EXPECTED COUNT FORMULAS
For a goodness-of-fit test, each expected count is the total sample size times the hypothesized proportion for that category. For two-way tables (homogeneity and independence), expected counts come from row and column totals.
AP Exam Tip
SECTION 5
Detailed Decision Guide: Key Distinguishing Features
The most common errors on the AP exam involve confusing the chi-square test of homogeneity with the chi-square test of independence, or failing to recognize when a simpler z-test for proportions suffices. The following comparison table and diagram isolate the exact features that distinguish each procedure. Internalize these distinctions and you will navigate even the trickiest scenarios with ease.
| Feature | 1-Prop z | 2-Prop z | χ² GOF | χ² Homogeneity | χ² Independence |
|---|---|---|---|---|---|
| # of variables | 1 | 1 | 1 | 1 | 2 |
| # of categories | 2 | 2 | 2+ | 2+ | 2+ each |
| # of populations | 1 | 2 | 1 | 2+ | 1 |
| Sampling design | 1 SRS | 2 independent SRS | 1 SRS | Independent samples from each pop. | 1 SRS classified on 2 variables |
| Hypotheses focus | p = p₀ | p₁ − p₂ = 0 | Distribution matches claim | Distributions are same across pops. | Variables are independent |
| Allows one-sided Hₐ? | Yes | Yes | No | No | No |
Comparison of the five categorical inference procedures tested on the AP Statistics exam.
- Homogeneity vs. Independence: The computation is identical, but the sampling design differs. Homogeneity uses independent samples from separate populations; independence uses a single sample classified on two variables. State the correct name in your free response.
- z-test vs. χ² for binary data: When you have exactly two categories and two groups, the two-proportion z-test and the 2 × 2 chi-square test of homogeneity yield equivalent two-sided p-values (because z² = χ²). Use the z-test if your alternative is one-sided.
- GOF vs. 1-Prop z: If a single population is divided into exactly two categories and you are testing whether the proportion equals a specific value, either test works, but the z-test again permits directionality.
 The way people or groups enter a study determines its design. Sampling within groups, selecting whole groups and assigning treatments answer different questions.
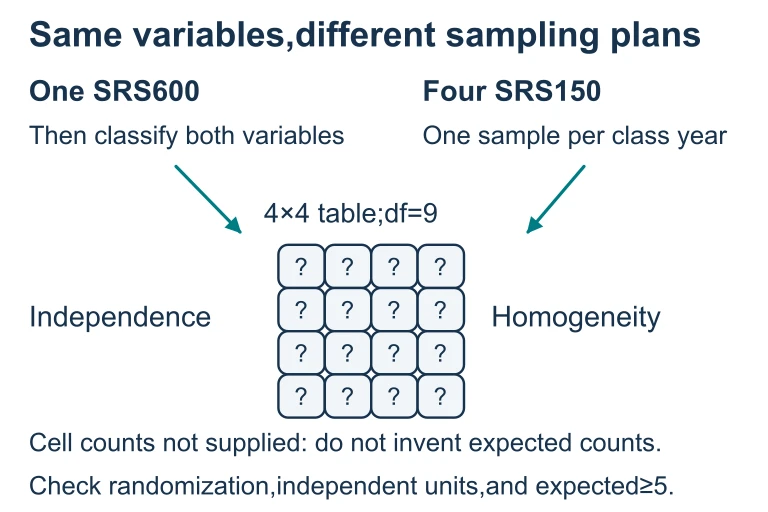 In this four-by-four setup, one SRS of 600 people classified twice supports an independence test; four separate SRSs of 150 support homogeneity. Both have df = 9. The actual cell counts are needed to calculate and check expected counts.
SECTION 6
Worked Example: Choosing the Right Procedure
A university researcher surveys a random sample of 600 undergraduates and records each student's year (Freshman, Sophomore, Junior, Senior) and preferred study environment (Library, Dorm Room, Café, Other). She wants to determine whether there is an association between class year and preferred study location. Let's walk through the decision process.
Selecting and Justifying the Correct Test
- 1
Step 1 — Identify the Type of Data
Both class year and preferred study environment are categorical variables. We are not comparing means or measuring a quantitative response, so our inference procedure must come from the categorical inference family. - 2
Step 2 — Count the Variables
There are two categorical variables: class year (4 categories) and study environment (4 categories). Two categorical variables means we are in the right branch of the flowchart, heading toward either homogeneity or independence. - 3
Step 3 — Identify the Sampling Design
The researcher drew a single random sample of 600 students and then classified each student on both variables simultaneously. She did not sample separately from freshmen, sophomores, juniors, and seniors. This single-sample design means we are looking at independence, not homogeneity.→ χ² Test of Independence - 4
Step 4 — State the Hypotheses
H₀: Class year and preferred study environment are independent in the population of undergraduates at this university. Hₐ: Class year and preferred study environment are not independent (i.e., there is an association). Note that chi-square tests of independence are always two-sided. - 5
Step 5 — Verify Conditions
Random: The sample was a random sample of 600 undergraduates. Large counts: We would need to compute all expected counts using E_ij = (row i total × column j total) / 600 and verify that every expected count is at least 5. Independence (of observations): 600 is almost certainly less than 10% of the university's undergraduate population. All conditions are plausible. - 6
Step 6 — Identify Degrees of Freedom
df = (r − 1)(c − 1) = (4 − 1)(4 − 1) = 9. The chi-square statistic would be compared to the χ² distribution with 9 degrees of freedom.df = 9
Contrast Scenario
SECTION 7
Strengths, Limitations & Common Pitfalls
Knowing the right procedure is only half the battle; you also need to understand the strengths and limitations of each test so you can discuss them intelligently on a free-response question or spot distractors on a multiple-choice item. The following table summarizes the practical advantages and constraints of each categorical inference procedure.
| Procedure | Strengths | Limitations |
|---|---|---|
| 1-Prop z-test | Simple, allows one-sided alternatives, yields a confidence interval for p. Well-suited when the research question targets a single proportion. | Only handles two categories (success/failure). Requires np₀ ≥ 10 and n(1 − p₀) ≥ 10; not robust to violations. |
| 2-Prop z-test | Allows one-sided alternatives; can construct a confidence interval for p₁ − p₂. Natural choice for comparing two treatments on a binary outcome. | Limited to two groups and a binary variable. Requires large-count conditions on the pooled proportion. Cannot handle 3+ groups. |
| χ² GOF | Handles any number of categories (k ≥ 2). Can test against any hypothesized distribution, including uniform, historical, or theoretical. | Always two-sided; cannot detect which specific category deviates. Requires all expected counts ≥ 5. |
| χ² Homogeneity | Compares distributions across 2+ populations. Flexible for any number of response categories. Commonly used in experiments with multiple treatment groups. | Two-sided only; a significant result does not indicate which populations differ. Requires independent samples and all expected counts ≥ 5. |
| χ² Independence | Tests association between any two categorical variables. Requires only a single sample. Flexible table dimensions (r × c). | Two-sided only; detects association but not direction or causation. Requires all expected counts ≥ 5. Does not yield an effect-size measure directly. |
Strengths and limitations of each categorical inference procedure.
KEY TAKEAWAY
SECTION 8
Connections to Advanced Theory
The categorical inference procedures you learn in AP Statistics are a gateway to a rich landscape of advanced methods used in biostatistics, social science, and machine learning. Understanding how these foundational tests connect to their more powerful successors deepens your conceptual grasp and prepares you for college-level coursework.
| AP Statistics Procedure | Advanced Extension | What It Adds |
|---|---|---|
| 1-Prop z-test / 2-Prop z-test | Logistic Regression | Models the probability of a binary outcome as a function of one or more predictors (both categorical and quantitative), allowing for multiple covariates and interactions. |
| χ² Test of Independence | Log-Linear Models | Extends to three-way or higher-dimensional contingency tables, modeling associations among multiple categorical variables simultaneously. |
| χ² GOF | Kolmogorov–Smirnov / Anderson–Darling | Tests distributional fit for continuous data; does not require binning into categories, yielding greater power against many alternatives. |
| χ² Homogeneity | Multinomial Logistic Regression | Models the distribution of a multi-category response across groups while adjusting for confounders and estimating individual category probabilities. |
| All chi-square tests (small samples) | Fisher's Exact Test / Permutation Tests | Provides exact p-values when expected counts are too small for the χ² approximation to be reliable, especially in 2 × 2 tables. |
How AP-level categorical inference procedures connect to advanced statistical methods.
A particularly elegant connection is the mathematical relationship between the z-test and the chi-square test for 2 × 2 tables. When you square the z-statistic from a two-proportion z-test, you obtain exactly the χ² statistic from the corresponding 2 × 2 homogeneity test: z² = χ². This identity arises because the chi-square distribution with 1 degree of freedom is the distribution of a squared standard normal variable. Recognizing this helps you see that these are not truly separate tests but rather different lenses on the same underlying comparison—one that supports directionality and one that does not.
SECTION 9
Practice Problems
Question 1: CONCEPTUAL
- A. One-proportion z-test
- B. Two-proportion z-test
- C. Chi-square goodness-of-fit test
- D. Chi-square test of independence
- E. Chi-square test of homogeneity
Show answer (D)
Question 2: BASIC CALCULATION
- A. H₀: p = 0.30; df = 1
- B. H₀: The distribution of candy colors matches the manufacturer's claim; df = 4
- C. H₀: The distribution of candy colors matches the manufacturer's claim; df = 5
- D. H₀: Color and frequency are independent; df = 4
- E. H₀: The distribution of candy colors is uniform; df = 4
Show answer (B)
Question 3: INTERMEDIATE
- A. Chi-square test of independence, because there are two treatment groups
- B. Chi-square test of homogeneity, because the response variable has more than two categories and two independent groups are being compared
- C. Two-proportion z-test, because there are two treatment groups
- D. Chi-square goodness-of-fit, because we are comparing to an expected distribution
- E. Chi-square test of independence, because the outcome has three categories
Show answer (B)
Question 4: APPLIED
4 ptsShow answer
Question 5: CRITICAL THINKING
5 ptsShow answer
SUMMARY
Summary & Review
Summary
Selecting the correct inference procedure for categorical data hinges on three diagnostic questions: How many categorical variables are involved? (one vs. two), How many populations or groups are being studied? (one vs. two or more), and How many categories does the response variable have? (two vs. three or more). For a single binary variable in one population, use the one-proportion z-test; to compare binary proportions across two independent groups, use the two-proportion z-test. When the variable has three or more categories in a single population, apply the chi-square goodness-of-fit test; when comparing multi-category distributions across independently sampled groups, use the chi-square test of homogeneity; and when a single sample is classified on two categorical variables, use the chi-square test of independence.
Remember that the z-tests allow one-sided alternatives while all chi-square tests are inherently two-sided. The sampling design—one sample vs. multiple independent samples—is the key distinction between independence and homogeneity, even though the computations are identical. Always state the name of your chosen procedure explicitly, verify conditions (random sampling, expected counts ≥ 5, and the 10% condition where applicable), and connect your conclusion back to the context of the problem.