

SECTION 1
Historical Context & Motivation
Much of modern statistics grew out of a deceptively simple question: when we observe a difference between two groups, how do we know it isn't just noise? Agricultural scientists measuring crop yields across different fertilizer treatments, medical researchers comparing drug outcomes to placebos, and psychologists contrasting reaction times under varying conditions all faced the same inferential challenge. Quantifying the sampling variability of the difference between two sample means became one of the central problems of 20th-century statistics, ultimately enabling the two-sample t-procedures that appear throughout applied science.
1908 • Student's t-distribution
1922 • Fisher Formalizes Sampling Theory
1935 • Design of Experiments Published
1947 • Welch's Approximate t-test
The conceptual thread running through this history is that a single observed difference x̄₁ − x̄₂ means little on its own; we need to know how much that difference would vary across all possible pairs of random samples. That is precisely what the sampling distribution of the difference in sample means describes, and mastering it is the gateway to two-sample inference on the AP Statistics exam.
SECTION 2
Core Principles & Definitions
Before diving into formulas, it is essential to internalize the building blocks. If you already understand the sampling distribution of a single sample mean, extending to the difference of two means requires just a few additional ideas—each grounded in the properties of independent random variables.
Sampling Distribution of x̄₁ − x̄₂
Center: μ₁ − μ₂
Spread: Standard Error
Shape: Approximately Normal
Independence Condition
KEY TAKEAWAY
SECTION 3
Visual Explanation
The diagram below illustrates how two separate population distributions give rise to their own sampling distributions of x̄, and how combining those two sampling distributions produces the sampling distribution of x̄₁ − x̄₂. Notice that the center of the bottom distribution sits at μ₁ − μ₂, and its spread reflects the combined uncertainty from both samples.
Several features of this diagram deserve emphasis. First, the violet curve at the bottom is narrower relative to the original populations because sampling distributions are always less variable than the parent distributions from which they arise—the factor of 1/n inside each variance term ensures this. Second, the shape is approximately normal even if the two parent populations are not perfectly normal, provided both sample sizes are large enough (typically n₁ ≥ 30 and n₂ ≥ 30 serves as a working guideline, though smaller samples suffice when the populations are unimodal and roughly symmetric). Third, the center of μ₁ − μ₂ = 10 is deterministic: no matter how many times we repeat the sampling process, the average of all possible differences in sample means equals the true difference in population means.
SECTION 4
Mathematical Framework
The properties of the sampling distribution of x̄₁ − x̄₂ follow directly from two foundational results: the linearity of expectation and the variance addition rule for independent random variables. Let X̄₁ and X̄₂ be the sample means from two independent random samples of sizes n₁ and n₂ drawn from populations with means μ₁, μ₂ and standard deviations σ₁, σ₂ respectively.
MEAN OF THE DIFFERENCE
The expected value of the difference in sample means equals the difference in population means. This follows from E(X̄₁ − X̄₂) = E(X̄₁) − E(X̄₂) = μ₁ − μ₂ by linearity of expectation.
STANDARD ERROR (POPULATION σ KNOWN)
Because X̄₁ and X̄₂ are independent, Var(X̄₁ − X̄₂) = Var(X̄₁) + Var(X̄₂) = σ₁²/n₁ + σ₂²/n₂. The standard error is the square root of this sum. Note that variances add even though we are subtracting means—this is a critical conceptual point.
STANDARD ERROR (σ ESTIMATED FROM SAMPLES)
In practice, population standard deviations are unknown. We replace σ₁ and σ₂ with the sample standard deviations s₁ and s₂. This estimated standard error is used in t-procedures for two-sample inference.
SHAPE CONDITION (CLT)
The Central Limit Theorem guarantees approximate normality for large samples regardless of population shape. When the parent populations are themselves normal, the sampling distribution of x̄₁ − x̄₂ is exactly normal for any sample sizes.
Why Variances Add for Differences
SECTION 5
Conditions & Checking Assumptions
On the AP Statistics exam, you will be expected to verify three categories of conditions before using the normal model for x̄₁ − x̄₂. Free-response rubrics consistently award points for explicitly stating and checking these conditions. The following diagram and table break them down clearly.
| Condition | What to Check | What to Write on the Exam |
|---|---|---|
| Random | Both samples come from random selection or random assignment in an experiment. | "We are told that both samples were selected via SRS from their respective populations." |
| Independent (10%) | The two samples are independent of each other, and each n is less than 10% of its population N. | "It is reasonable that n₁ = 40 < 10% of all [population 1] and n₂ = 50 < 10% of all [population 2], so independence holds." |
| Normal (Large Counts / CLT) | n₁ ≥ 30 and n₂ ≥ 30, or the parent populations are approximately normal with no strong skew/outliers. | "Since n₁ = 40 ≥ 30 and n₂ = 50 ≥ 30, the CLT ensures the sampling distribution of x̄₁ − x̄₂ is approximately normal." |
Conditions checklist with AP-exam-style phrasing
 Measurements taken from the same person remain linked. Compare within-person differences instead of treating the two columns as independent samples.
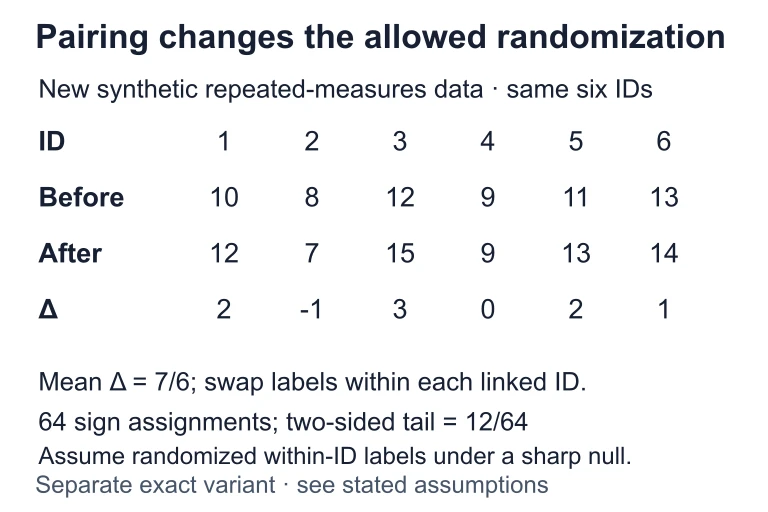 Suppose the same six IDs have differences 2, −1, 3, 0, 2 and 1, averaging 7/6. Under a sharp zero-effect null with randomized or exchangeable within-ID labels, 2⁶ = 64 sign assignments are allowed; 12 have absolute mean at least 7/6. Repeated measurement alone does not establish that exchangeability.
SECTION 6
Worked Example
A researcher wants to compare the average time (in minutes) that college students spend studying per day at two universities. A random sample of 36 students from University A yields x̄₁ = 142 minutes with s₁ = 28 minutes. An independent random sample of 45 students from University B yields x̄₂ = 128 minutes with s₂ = 32 minutes. Describe the sampling distribution of x̄₁ − x̄₂ and find the probability that the difference in sample means exceeds 25 minutes, assuming the true difference in population means is μ₁ − μ₂ = 14.
Describing and Using the Sampling Distribution of x̄₁ − x̄₂
- 1
Step 1 — Verify Conditions
Random: Both samples are described as random samples. Independent: The samples come from separate universities and are independent. Since 36 < 10% of all students at University A and 45 < 10% of all students at University B (assuming each has more than 360 and 450 students, respectively), the 10% condition is satisfied for both. Normal: n₁ = 36 ≥ 30 and n₂ = 45 ≥ 30, so the CLT ensures approximate normality. - 2
Step 2 — State the Center (Mean)
The mean of the sampling distribution of x̄₁ − x̄₂ is μ₁ − μ₂ = 14 minutes.μ_{x̄₁ − x̄₂} = 14 minutes - 3
Step 3 — Compute the Standard Error
Using the sample standard deviations as estimates for σ₁ and σ₂: SE = √(s₁²/n₁ + s₂²/n₂) = √(28²/36 + 32²/45) = √(784/36 + 1024/45) = √(21.778 + 22.756) = √44.534 ≈ 6.673 minutes.SE ≈ 6.673 minutes - 4
Step 4 — State the Sampling Distribution
The sampling distribution of x̄₁ − x̄₂ is approximately Normal(14, 6.673). In notation: x̄₁ − x̄₂ ~ N(14, 6.673). - 5
Step 5 — Compute the z-score and Probability
We want P(x̄₁ − x̄₂ > 25). The z-score is z = (25 − 14) / 6.673 = 11 / 6.673 ≈ 1.649. Using the standard normal table or calculator: P(Z > 1.649) ≈ 0.0497.P(x̄₁ − x̄₂ > 25) ≈ 0.0497 - 6
Step 6 — Interpret in Context
If the true difference in mean study times between the two universities is 14 minutes, there is approximately a 5.0% probability of observing a difference in sample means exceeding 25 minutes from samples of these sizes.
SECTION 7
Common Errors & Exam Pitfalls
AP Statistics scorers report that certain mistakes recur year after year on free-response questions involving two-sample inference. Understanding these pitfalls in advance can prevent lost points and deepen your conceptual grasp of sampling distributions.
| Common Error | Why It's Wrong | Correct Approach |
|---|---|---|
| Subtracting standard errors | Writing SE = √(σ₁²/n₁) − √(σ₂²/n₂) confuses standard deviations with variances. Subtraction of SDs is not a valid operation for combining independent variabilities. | Add the variances first, then take the square root: SE = √(σ₁²/n₁ + σ₂²/n₂). |
| Subtracting variances | Writing Var = σ₁²/n₁ − σ₂²/n₂ because the statistic involves subtraction. Variances always add for independent random variables, regardless of whether we add or subtract the variables. | Var(X̄₁ − X̄₂) = Var(X̄₁) + Var(X̄₂) = σ₁²/n₁ + σ₂²/n₂. |
| Forgetting to check conditions | Jumping straight to calculation without verifying Random, Independent, and Normal conditions. This typically costs 1–2 rubric points on FRQs. | Always state all three conditions and show evidence for each before proceeding with calculations. |
| Confusing σ and s | Using population parameters σ₁ and σ₂ in formulas when only sample statistics s₁ and s₂ are available, or vice versa. | Use σ only when population standard deviations are explicitly given; otherwise use s and note that the result is an estimated standard error. |
| Context-free interpretation | Stating a probability without referring to what x̄₁ − x̄₂ represents in the problem context. | Always interpret probabilities in context: "There is a 5% chance the difference in sample mean study times exceeds 25 minutes, assuming…" |
Common exam errors and corrections for two-sample mean inference
EXAM STRATEGY
SECTION 8
Connection to Two-Sample t-Inference
Everything developed in this lesson about the sampling distribution of x̄₁ − x̄₂ is the theoretical foundation upon which two-sample t-confidence intervals and two-sample t-tests are built. When you construct a confidence interval for μ₁ − μ₂ or conduct a hypothesis test about whether μ₁ − μ₂ equals zero, you are using the sampling distribution to quantify how far the observed x̄₁ − x̄₂ might plausibly fall from the true parameter.
| Concept | This Lesson (Sampling Distribution) | Next Topic (Two-Sample t-Procedures) |
|---|---|---|
| Parameter of interest | μ₁ − μ₂ (difference in population means) | Same: μ₁ − μ₂ |
| Statistic | x̄₁ − x̄₂ | Same: x̄₁ − x̄₂ |
| Standard error | σ known: √(σ₁²/n₁ + σ₂²/n₂); σ unknown: √(s₁²/n₁ + s₂²/n₂) | Always estimated: √(s₁²/n₁ + s₂²/n₂) |
| Distribution used | Normal (z) when σ known; t when σ estimated | t-distribution with Welch's df: df ≈ (s₁²/n₁ + s₂²/n₂)² / [(s₁²/n₁)²/(n₁−1) + (s₂²/n₂)²/(n₂−1)] |
| Primary use | Describing the distribution and computing probabilities about x̄₁ − x̄₂ | Constructing confidence intervals and performing hypothesis tests for μ₁ − μ₂ |
Bridge from sampling distributions to formal two-sample inference
The key transition is straightforward: once you know how to describe the center, spread, and shape of the sampling distribution of x̄₁ − x̄₂, constructing a confidence interval simply means placing a margin of error around the observed difference, and conducting a hypothesis test means measuring how many standard errors the observed difference lies from the hypothesized value (usually zero). The Welch's degrees of freedom formula adjusts for the fact that when we estimate σ from data, the normal model slightly understates the tails; the t-distribution corrects this. On the AP exam, your calculator handles the df computation, but understanding the sampling distribution from this lesson is what makes the entire procedure meaningful.
SECTION 9
Practice Problems
Question 1: CONCEPTUAL
- A. σ₁/√n₁ − σ₂/√n₂
- B. √(σ₁²/n₁ − σ₂²/n₂)
- C. √(σ₁²/n₁ + σ₂²/n₂)
- D. (σ₁ + σ₂)/√(n₁ + n₂)
- E. √(σ₁² + σ₂²)/√(n₁ + n₂)
Show answer (C)
Question 2: BASIC CALCULATION
- A. 2.00
- B. 2.83
- C. 4.00
- D. 8.00
- E. 30.00
Show answer (B)
Question 3: INTERMEDIATE
- A. 0.0082
- B. 0.0033
- C. 0.0052
- D. 0.0250
- E. 0.0500
Show answer (B)
Question 4: APPLIED
7 ptsShow answer
Question 5: CRITICAL THINKING
7 ptsShow answer
SUMMARY
Lesson Summary
Summary
The sampling distribution of x̄₁ − x̄₂ describes how the difference in sample means varies across all possible pairs of independent random samples. Its center is μ₁ − μ₂, making it an unbiased estimator of the true difference in population means. Its standard error is √(σ₁²/n₁ + σ₂²/n₂) — critically, variances always add for independent random variables, even when means are subtracted. Its shape is approximately normal when both sample sizes are at least 30 (by the Central Limit Theorem) or when both populations are normal.
Before applying this model, always verify the three conditions: Random (both samples arise from random selection or random assignment), Independent (the two samples are independent and each satisfies the 10% condition), and Normal (the CLT applies or populations are normal). This sampling distribution is the theoretical backbone of two-sample t-intervals and t-tests, which you will encounter next in the AP Statistics curriculum.