

SECTION 1
Historical Context & Motivation
The question of how reliably a sample reflects a larger population has occupied mathematicians and scientists for centuries. When a pollster surveys 1,000 voters and reports that 54% support a candidate, the natural follow-up is: how close is that 54% to the true proportion in the entire electorate? Answering this question requires understanding the sampling distribution of the sample proportion—the probability distribution that describes how p̂ (the sample proportion) behaves across all possible random samples of a given size. The development of this idea spans several centuries and reflects a deep interplay between probability theory, mathematical analysis, and practical statistical reasoning.
1713 • Bernoulli's Ars Conjectandi
1733 • De Moivre's Normal Approximation
1812 • Laplace Generalizes the CLT
1935 • Neyman's Confidence Intervals
These historical developments converge on a single powerful idea: even though individual samples are imperfect reflections of their populations, the pattern of variation across many samples is predictable. This predictability is precisely what allows us to quantify uncertainty through margins of error, confidence intervals, and hypothesis tests. The central question this lesson addresses is: if we know the true population proportion p, what can we say about the shape, center, and spread of p̂ across all possible samples of size n?
SECTION 2
Core Principles & Definitions
Before examining the mathematical machinery, it is essential to establish the foundational concepts that govern how sample proportions behave. Each principle below builds upon the preceding one: we start with the distinction between a parameter and a statistic, move to the concept of a sampling distribution, and then state the conditions under which a remarkably clean normal model applies.
Parameter vs. Statistic
Sampling Distribution Defined
Center: Unbiasedness
Spread: Standard Deviation
Shape: Normal Approximation
KEY TAKEAWAY
SECTION 3
Visual Explanation: From Population to Sampling Distribution
The following diagram illustrates the conceptual process of constructing a sampling distribution. Imagine a large population with true proportion p = 0.40. We repeatedly draw random samples of size n = 50, compute p̂ for each sample, and then plot the distribution of all those p̂ values. The resulting histogram forms the sampling distribution, which—when the Large Counts Condition is satisfied—takes on the characteristic bell shape of a normal distribution centered at p.
Notice several important features in the diagram. First, each individual sample produces a different p̂ value—0.38, 0.44, 0.36, and so on—reflecting natural sampling variability. Second, when we aggregate thousands of these p̂ values, the histogram forms a smooth, symmetric bell curve centered on the true population proportion p = 0.40. Third, the spread of this distribution—governed by σp̂ = √(0.40 × 0.60 / 50) ≈ 0.069—quantifies how much p̂ typically deviates from p in a single sample. About 68% of all sample proportions fall within one standard deviation of the center, and about 95% fall within two standard deviations.
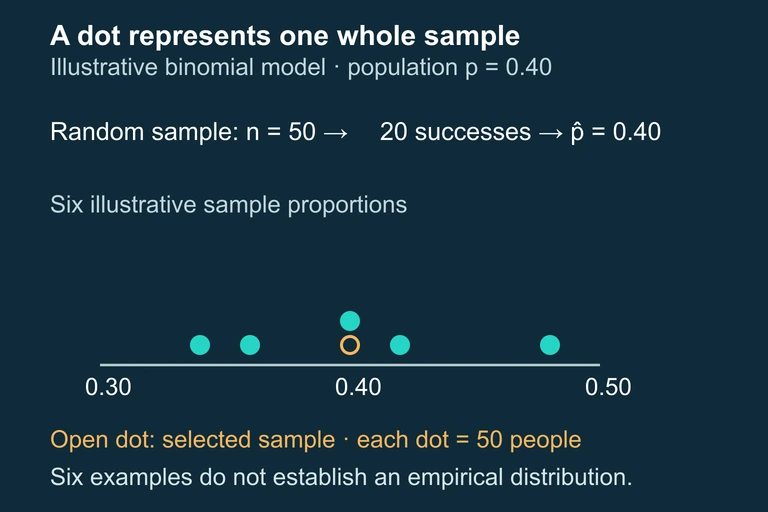 Each plotted sampling-distribution mark summarizes a whole 50-person sample rather than one student; the displayed small sequence is illustrative. The wider sampling distribution has standard error about 0.069.
SECTION 4
Mathematical Framework
The sampling distribution of p̂ arises from the binomial distribution. If each observation in a sample of size n independently has probability p of being a "success," then the count X of successes follows a Binomial(n, p) distribution. Since p̂ = X/n, the properties of p̂ follow directly from those of X. The three key formulas below describe the center, spread, and approximate shape of the distribution of p̂.
MEAN OF THE SAMPLING DISTRIBUTION
The expected value of p̂ equals the population proportion p, confirming that p̂ is an unbiased estimator. No matter the sample size, the center of the sampling distribution always aligns with the true parameter.
STANDARD DEVIATION OF THE SAMPLING DISTRIBUTION
Here p is the population proportion and n is the sample size. This formula assumes either an infinite population or sampling with replacement. When sampling without replacement from a finite population of size N, multiply by the finite population correction factor √((N − n)/(N − 1)). The correction is negligible when n < 10% of N (the 10% Condition).
NORMAL APPROXIMATION (LARGE COUNTS CONDITION)
The Large Counts Condition ensures that the expected number of successes (np) and expected number of failures (n(1 − p)) are both at least 10. When this holds, the binomial-based distribution of p̂ is well-approximated by the normal distribution, enabling us to use z-scores for probability calculations.
Z-SCORE FOR A SAMPLE PROPORTION
This standardization converts a p̂ value into a z-score, measuring how many standard deviations p̂ lies from the center p. This z-score is essential for computing probabilities and performing hypothesis tests about population proportions.
Conditions Checklist for AP Exams
SECTION 5
How Sample Size and Population Proportion Affect the Distribution
The shape and spread of the sampling distribution of p̂ depend on two quantities: the sample size n and the population proportion p. Understanding their effects is critical both for designing studies and for reasoning about results on the AP exam. The diagram below shows how the sampling distribution changes as n increases, holding p constant at 0.30.
The visual makes a crucial relationship concrete: since σp̂ = √(p(1 − p)/n), the standard deviation is inversely proportional to the square root of n. This means quadrupling the sample size cuts the standard deviation in half. Going from n = 25 to n = 100 (a factor of 4) reduces σp̂ from 0.092 to 0.046—exactly half. This square-root relationship has practical implications for survey design: achieving twice the precision requires four times the sample size, which means four times the cost.
| Sample Size (n) | σ_p̂ (when p = 0.30) | Large Counts Met? | Approx. 95% Range for p̂ |
|---|---|---|---|
| 10 | 0.145 | No (np = 3) | Normal model not appropriate |
| 50 | 0.065 | Yes (np = 15, n(1−p) = 35) | (0.17, 0.43) |
| 200 | 0.032 | Yes (np = 60, n(1−p) = 140) | (0.24, 0.36) |
| 1000 | 0.014 | Yes (np = 300, n(1−p) = 700) | (0.27, 0.33) |
Sampling distribution characteristics for p = 0.30 at various sample sizes
The value of p also affects the standard deviation and the validity of the normal approximation. The product p(1 − p) is maximized when p = 0.50 and decreases symmetrically as p approaches 0 or 1. When p is extreme (near 0 or 1), the sampling distribution is more skewed and requires a larger n to satisfy the Large Counts Condition. For instance, with p = 0.05, you would need n ≥ 200 to reach np = 10, whereas with p = 0.50, even n = 20 suffices.
SECTION 6
Worked Example: Finding a Probability for p̂
A large university reports that 65% of its students graduate in four years. A researcher takes a simple random sample of 150 students. What is the probability that the sample proportion of four-year graduates exceeds 0.70?
Computing P(p̂ > 0.70) Using the Normal Model
- 1
Step 1 — Identify Given Values
Population proportion: p = 0.65. Sample size: n = 150. We want P(p̂ > 0.70).p = 0.65, n = 150, target p̂ = 0.70 - 2
Step 2 — Verify Conditions
Random: The problem states the sample is a simple random sample. ✓ Independence (10% Condition): A large university has far more than 1,500 students, so 150 < 10% of the population. ✓ Large Counts: np = 150 × 0.65 = 97.5 ≥ 10 ✓ and n(1 − p) = 150 × 0.35 = 52.5 ≥ 10 ✓. All conditions are satisfied.All three conditions met — normal model is appropriate - 3
Step 3 — Compute Mean and Standard Deviation
Mean: μp̂ = p = 0.65. Standard deviation: σp̂ = √(0.65 × 0.35 / 150) = √(0.2275 / 150) = √(0.001517) ≈ 0.03894.μ_p̂ = 0.65, σ_p̂ ≈ 0.0389 - 4
Step 4 — Compute the z-Score
z = (p̂ − p) / σp̂ = (0.70 − 0.65) / 0.03894 = 0.05 / 0.03894 ≈ 1.284.z ≈ 1.28 - 5
Step 5 — Find the Probability
Using the standard normal table or calculator: P(Z > 1.28) = 1 − P(Z ≤ 1.28) = 1 − 0.8997 ≈ 0.1003. On a TI-84, you could compute normalcdf(0.70, 1E99, 0.65, 0.03894) ≈ 0.0994.P(p̂ > 0.70) ≈ 0.10, or about 10% - 6
Step 6 — Interpret in Context
If the true four-year graduation rate is 65%, there is approximately a 10% chance that a random sample of 150 students would yield a sample proportion of four-year graduates exceeding 0.70. This result is somewhat unusual but not extraordinarily rare—it would happen about 1 in 10 times by chance alone.
SECTION 7
Common Errors & Misconceptions
Even students with a solid grasp of the formulas frequently lose points on the AP exam due to subtle but important errors. The table below catalogues the most common mistakes and their corrections, drawing on patterns observed in released AP scoring guidelines.
| Common Error | Why It's Wrong | Correct Approach |
|---|---|---|
| Using p̂ (from sample data) in the standard deviation formula when p is known | The standard deviation σ_p̂ requires the true population proportion p. Substituting p̂ yields the standard error, which is appropriate for confidence intervals but not when the population parameter is known (e.g., hypothesis testing). | Use σ_p̂ = √(p(1−p)/n) when p is given. Use SE = √(p̂(1−p̂)/n) only when estimating from data. |
| Confusing the distribution of X with the distribution of p̂ | X ~ Binomial(n, p) counts successes; p̂ = X/n is a proportion. Their means and standard deviations differ by a factor of n. | For p̂: mean = p, SD = √(p(1−p)/n). For X: mean = np, SD = √(np(1−p)). Be clear about which you are modeling. |
| Forgetting to check or state the conditions | Applying the normal model without verifying the Random, 10%, and Large Counts conditions loses points on FRQs. The rubric typically dedicates 1–2 points to conditions alone. | Always state all three conditions with context-specific verification: name the condition, show the numerical check, and state whether it is satisfied. |
| Claiming the sampling distribution is always normal | When np or n(1−p) is less than 10, the distribution of p̂ is noticeably skewed and the normal model provides poor approximations, especially in the tails. | State that the distribution is approximately normal only when the Large Counts Condition is met. For small samples or extreme p, use the exact binomial distribution. |
| Believing larger samples change the population distribution | Increasing n does not alter the population. It makes the sampling distribution of the statistic narrower and more normal, but the underlying population remains unchanged. | Distinguish clearly between the population distribution (fixed) and the sampling distribution of p̂ (depends on n). Larger n → narrower sampling distribution, not a different population. |
Common errors and misconceptions about the sampling distribution of p̂
KEY TAKEAWAY
SECTION 8
Connection to Inference: Confidence Intervals & Hypothesis Tests
The sampling distribution of p̂ is not merely an abstract concept—it is the engine that powers all inference about proportions on the AP Statistics exam. Both confidence intervals and hypothesis tests for a single proportion rely directly on the normal model for p̂ that we have developed. Understanding how the sampling distribution connects to these two inferential procedures is essential for performing well in Units 6 and 7 of the AP curriculum.
| Feature | Confidence Interval for p | Hypothesis Test for p |
|---|---|---|
| Goal | Estimate plausible values for the unknown p | Assess evidence against a claimed value p₀ |
| Formula | p̂ ± z* × √(p̂(1−p̂)/n) | z = (p̂ − p₀) / √(p₀(1−p₀)/n) |
| Which p in the SD? | p̂ (standard error), because p is unknown | p₀ (standard deviation), because H₀ specifies p |
| Large Counts Check | np̂ ≥ 10 and n(1−p̂) ≥ 10 | np₀ ≥ 10 and n(1−p₀) ≥ 10 |
| Sampling dist. used | Distribution of p̂ centered at the true (unknown) p | Distribution of p̂ centered at p₀ (assuming H₀ is true) |
Comparison of how the sampling distribution of p̂ is used in confidence intervals vs. hypothesis tests
Looking forward, the same conceptual framework extends to two-proportion inference (comparing p₁ − p₂), where the sampling distribution of p̂₁ − p̂₂ is approximately normal under analogous conditions. Beyond proportions, the idea of a sampling distribution underlies inference for means (using the t-distribution), regression slopes, and chi-square tests. Mastering the single-proportion case thoroughly—especially the logic of checking conditions and computing standard deviations—provides a template that transfers directly to every other inferential procedure on the AP exam.
SECTION 9
Practice Problems
Question 1: CONCEPTUAL
- A. The mean shifts closer to 0.50 and the standard deviation decreases.
- B. The mean stays at 0.50 and the standard deviation decreases.
- C. The mean stays at 0.50 and the standard deviation stays the same.
- D. The mean stays at 0.50 and the distribution becomes more skewed.
- E. The mean shifts to a value determined by the sample and the standard deviation decreases.
Show answer (B)
Question 2: BASIC CALCULATION
- A. 0.0014
- B. 0.0317
- C. 0.0450
- D. 0.2016
- E. 0.7200
Show answer (B)
Question 3: INTERMEDIATE
- A. 0.0092
- B. 0.0367
- C. 0.1038
- D. 0.8962
- E. The normal approximation cannot be used because the Large Counts Condition is not met.
Show answer (C)
Question 4: APPLIED
4 ptsShow answer
Question 5: CRITICAL THINKING
4 ptsShow answer
SUMMARY
Summary: Sampling Distributions for Sample Proportions
Summary
The sampling distribution of p̂ describes the probability distribution of the sample proportion across all possible random samples of size n from a population with true proportion p. Its center is μ_p̂ = p (making p̂ an unbiased estimator), and its spread is σ_p̂ = √(p(1 − p)/n), which decreases as sample size increases. The shape is approximately normal when the Large Counts Condition is satisfied (np ≥ 10 and n(1 − p) ≥ 10), allowing us to use z-scores to compute probabilities involving p̂.
Before applying the normal model on the AP exam, always verify three conditions: the sample must be random, the 10% Condition must hold (n < 10% of the population) to ensure approximate independence, and the Large Counts Condition must be met. This framework directly underpins confidence intervals and hypothesis tests for proportions—master the sampling distribution, and you hold the key to all proportion-based inference.