

SECTION 1
Historical Context & Motivation
Every statistical inference you will make on the AP exam — whether a confidence interval or a hypothesis test — rests on the idea that a sample statistic is a random variable with its own distribution. Before the eighteenth century, scholars had no formal framework for describing how a sample mean computed from one sample relates to the true population mean. Repeated measurements of astronomical positions, crop yields, or mortality rates produced different averages each time, but the pattern governing that variability remained elusive.
1733 • De Moivre's Normal Approximation
1810 • Laplace's Central Limit Theorem
1908 • Student's t-Distribution
1922 • Fisher Formalizes Sampling Theory
The central question these pioneers addressed remains the question driving this lesson: if we draw many random samples of the same size from a population and compute the mean of each sample, what shape, center, and spread does the resulting distribution of sample means take on? Answering that question precisely is what makes confidence intervals and significance tests possible.
SECTION 2
Core Principles & Definitions
Before diving into formulas, you need to internalize four foundational ideas that the AP exam tests repeatedly. The sampling distribution of the sample mean is the probability distribution of x̄ obtained by considering every possible random sample of size n from a population. In practice we cannot enumerate every sample, but we can describe the distribution's center, spread, and shape using theory.
Center — Unbiasedness
Spread — Standard Error
Shape — Central Limit Theorem
Independence — Random Sampling
KEY TAKEAWAY
SECTION 3
Visual Explanation — From Population to Sampling Distribution
The diagram below illustrates the core idea: a right-skewed population distribution is sampled repeatedly, and the resulting distribution of sample means becomes approximately normal and much narrower than the original population. Notice how increasing the sample size tightens the spread and improves the normality of the sampling distribution.
Several key features visible in the diagram deserve emphasis. First, all three distributions are centered at the same value μ, confirming that x̄ is an unbiased estimator. Second, the spread decreases by a factor of 1/√n, so quadrupling the sample size cuts the standard error in half. Third, even though the population is markedly skewed, the sampling distribution for n = 40 is visually indistinguishable from a normal curve — a direct consequence of the Central Limit Theorem.
 A tray contains individual observations, but its average contributes one value to a distribution of sample means. Repeating the sampling process reveals how that statistic varies.
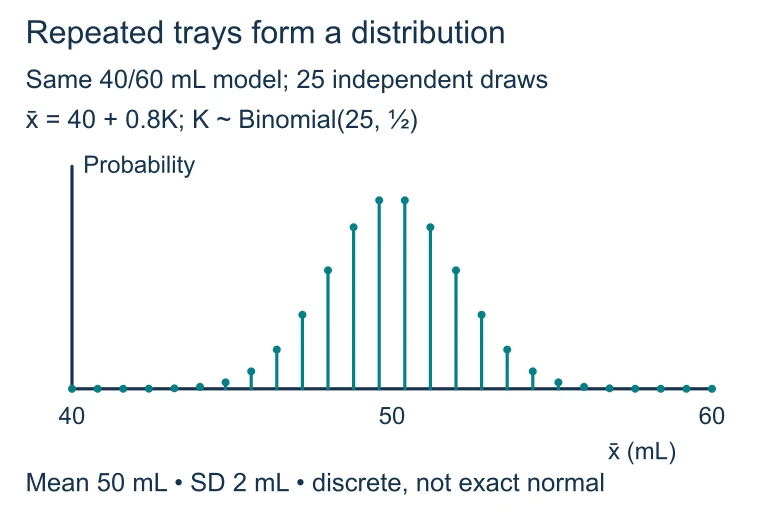 For 25 independent fills equally likely to be 40 or 60 mL, K is binomial with n = 25 and p = 0.5, and the tray mean is 40 + 0.8K. The exact distribution is discrete, centered at 50 mL with standard deviation 2 mL. A normal curve approximates its shape.
SECTION 4
Mathematical Framework
The sampling distribution of x̄ is fully characterized by three properties: center, spread, and shape. Each property has a precise mathematical statement you must know for the AP exam.
CENTER (MEAN OF x̄)
μx̄ is the mean of the sampling distribution; μ is the population mean. This holds for any sample size and any population shape.
SPREAD (STANDARD ERROR OF x̄)
σ is the population standard deviation; n is the sample size. This formula requires that observations are independent. When sampling without replacement, use the finite population correction factor √((N − n)/(N − 1)), but on the AP exam you may ignore it when n < 0.10N (the 10% condition).
SHAPE (CENTRAL LIMIT THEOREM)
If the population itself is normal, then x̄ is exactly normal for every n. If the population is non-normal, the approximation improves as n increases. The traditional guideline is n ≥ 30 for moderately skewed populations; for strongly skewed or outlier-prone populations, larger n may be needed.
STANDARDIZATION (Z-SCORE FOR x̄)
This z-score tells you how many standard errors a particular sample mean is from the population mean. It is the basis for computing probabilities about x̄ using the standard normal table or a calculator's normalcdf function.
AP Exam Tip — Conditions Checklist
SECTION 5
The Central Limit Theorem — A Closer Look
The Central Limit Theorem (CLT) is arguably the single most important theorem in introductory statistics. It guarantees that the distribution of x̄ converges to a normal distribution as n → ∞, no matter what the population distribution looks like — uniform, exponential, bimodal, or anything else. The rate of convergence depends on how far the population is from normality. A symmetric, unimodal population needs very few observations; a heavily skewed or multi-modal population requires more.
| Population Shape | n needed for approximate normality of x̄ | Guideline |
|---|---|---|
| Normal | Any n (exact normality) | No minimum required |
| Symmetric, no outliers | n ≥ 15 | CLT kicks in quickly |
| Moderately skewed | n ≥ 30 | Standard AP guideline |
| Strongly skewed or outlier-heavy | n ≥ 40 or more | Use caution; check graphical evidence |
Sample-size guidelines for applying the Central Limit Theorem
SECTION 6
Worked Example — Computing a Probability About x̄
The daily caloric intake of adults in a large city has a mean of μ = 2200 calories and a standard deviation of σ = 400 calories. The distribution is right-skewed. A nutritionist selects a simple random sample of 50 adults. What is the probability that the sample mean caloric intake exceeds 2300 calories?
Finding P(x̄ > 2300)
- 1
Step 1 — Identify the Given Information
Population mean μ = 2200, population standard deviation σ = 400, sample size n = 50, and we want P(x̄ > 2300). The population is right-skewed. - 2
Step 2 — Check Conditions
Random: The problem states a simple random sample. Independent: The city is large, so 50 < 10% of the population; the 10% condition is satisfied. Normal: n = 50 ≥ 30, so by the Central Limit Theorem, the sampling distribution of x̄ is approximately normal even though the population is right-skewed.All three conditions are met ✓ - 3
Step 3 — Compute the Standard Error
σx̄ = σ / √n = 400 / √50 = 400 / 7.0711 ≈ 56.57 calories.SE = 56.57 calories - 4
Step 4 — Standardize (compute the z-score)
z = (x̄ − μ) / σx̄ = (2300 − 2200) / 56.57 = 100 / 56.57 ≈ 1.77.z ≈ 1.77 - 5
Step 5 — Find the Probability
Using a standard normal table or the calculator command normalcdf(1.77, 1E99, 0, 1), we find P(Z > 1.77) ≈ 0.0384. Alternatively, normalcdf(2300, 1E99, 2200, 56.57) ≈ 0.0384.P(x̄ > 2300) ≈ 0.0384, or about 3.84% - 6
Step 6 — Interpret in Context
If we repeatedly draw random samples of 50 adults from this city, about 3.84% of those samples would have a mean caloric intake exceeding 2300 calories. This is a relatively unlikely outcome, suggesting that a sample mean of 2300 would be unusually high.
SECTION 7
Conditions, Common Pitfalls & Comparisons
Students frequently lose points on the AP exam because of predictable mistakes involving sampling distributions. The table below contrasts correct reasoning with the most common errors that graders see.
| Topic | Correct Understanding | Common Mistake |
|---|---|---|
| Standard error vs. σ | σx̄ = σ/√n describes the variability of sample means, which is smaller than σ. | Using σ instead of σ/√n in the z-score denominator, which overstates the spread of x̄. |
| CLT vs. Law of Large Numbers | CLT describes the shape of the sampling distribution. LLN says x̄ converges to μ. | Confusing the two, or saying 'the CLT says x̄ gets closer to μ.' |
| Normality of x̄ vs. normality of population | The CLT makes x̄ approximately normal; it does NOT make the population normal or any individual sample normal. | Writing 'the CLT says the population is approximately normal for large n.' |
| 10% condition | Required for independence when sampling without replacement: n < 0.10N. | Forgetting to check this condition or confusing it with the n ≥ 30 guideline for the CLT. |
| Known σ vs. estimated s | When σ is known, use z. When σ is unknown and estimated by s, use t. | Using a z-procedure when σ is unknown, or treating s and σ as interchangeable. |
Common pitfalls involving sampling distributions of x̄
KEY TAKEAWAY
SECTION 8
Connection to Inference & Advanced Topics
The sampling distribution of x̄ is not just an abstract concept — it is the engine that powers the two major inference procedures you will encounter later in the course: confidence intervals for μ and hypothesis tests about μ. Knowing that x̄ is approximately normal with mean μ and standard error σ/√n allows you to construct a z-interval (x̄ ± z* × σ/√n) when σ is known, or a t-interval (x̄ ± t* × s/√n) when it is not.
| Feature | This Lesson (Known σ, z-model) | Next Steps (Unknown σ, t-model) |
|---|---|---|
| Parameter for spread | σ (population SD, known) | s (sample SD, estimated) |
| Standard error formula | σ / √n | s / √n |
| Reference distribution | Standard normal (z) | t-distribution with df = n − 1 |
| Effect of small n | Still z, provided CLT or normality holds | Heavier tails to account for extra uncertainty in estimating σ |
| Practical frequency | Rare in practice (σ is seldom known) | Very common — the default one-sample t-procedure |
From z-model (this lesson) to t-model (upcoming inference)
As you move through the inference unit, you will also encounter sampling distributions for differences of means (x̄₁ − x̄₂), which extend the same logic: the center is μ₁ − μ₂, the standard error is √(σ₁²/n₁ + σ₂²/n₂), and the shape is approximately normal by the CLT when both samples are large enough. Mastering the single-sample case in this lesson provides the template for all of these extensions.
SECTION 9
Practice Problems
Question 1: CONCEPTUAL
- A. Strongly left-skewed with mean 50 and standard deviation 12
- B. Strongly left-skewed with mean 50 and standard deviation 1.5
- C. Approximately normal with mean 50 and standard deviation 1.5
- D. Approximately normal with mean 50 and standard deviation 12
- E. Exactly normal with mean 50 and standard deviation 1.5
Show answer (C)
Question 2: BASIC CALCULATION
- A. 0.0013
- B. 0.0228
- C. 0.0668
- D. 0.1587
- E. 0.3821
Show answer (C)
Question 3: INTERMEDIATE
- A. n = 5
- B. n = 10
- C. n = 15
- D. n = 20
- E. n = 50
Show answer (E)
Question 4: APPLIED
4 ptsShow answer
Question 5: CRITICAL THINKING
4 ptsShow answer
SUMMARY
Lesson Summary
Summary
The sampling distribution of the sample mean describes the behavior of x̄ across all possible random samples of size n from a population. Its center is μ (making x̄ an unbiased estimator), its spread is σ/√n (the standard error, which shrinks as n increases), and its shape becomes approximately normal by the Central Limit Theorem when n is sufficiently large — typically n ≥ 30 for skewed populations, though smaller n works for populations that are already close to normal.
To apply these results on the AP exam, always verify the Random, Independent (10% condition), and Normal/Large Sample conditions. Use z = (x̄ − μ) / (σ/√n) to standardize x̄ and find probabilities. Remember that the CLT describes the distribution of the statistic x̄, not the population itself. This foundational concept extends directly to confidence intervals and hypothesis tests for population means, forming the backbone of statistical inference.