

SECTION 1
Historical Context & Motivation
Statistical thinking has always been motivated by a deceptively simple question: how can we learn about a large group by examining only a small part of it? For centuries, governments conducted full censuses—counting every individual—but the cost and logistical burden of such efforts drove mathematicians and social scientists to develop sampling methods that could produce reliable conclusions from partial data. The intellectual leap from enumeration to inference depended on a single breakthrough idea: randomness as a deliberate tool for fairness. Without randomness, samples can systematically over-represent or under-represent segments of a population, producing conclusions that are not just imprecise but fundamentally misleading.
1895 • Anders Kiaer's Representative Method
1934 • Jerzy Neyman's Landmark Paper
1936 • The Literary Digest Debacle
1940s • Rise of Modern Survey Sampling
2000s–Present • Digital-Age Sampling Challenges
The 1936 Literary Digest disaster remains the most cited cautionary tale in statistics: a massive sample drawn from telephone directories and automobile registrations over-represented wealthier voters, producing a prediction that was spectacularly wrong. Meanwhile, George Gallup's far smaller but carefully randomized sample produced an accurate forecast. The lesson crystallized what Neyman had proven theoretically—how you select your sample matters far more than how large it is. This section of the AP Statistics curriculum asks you to master the principles that make data collection valid, recognizing that every confidence interval, hypothesis test, and regression model you will ever build depends on the integrity of the data feeding it.
SECTION 2
Core Principles & Definitions
Before examining specific sampling techniques, you need a precise vocabulary. A population is the entire group of individuals or objects about which you want information—every registered voter, every light bulb produced on a factory line, every white-tailed deer in a national forest. A sample is the subset of the population that you actually observe. The goal of statistical sampling is to use information from the sample to draw conclusions—inferences—about the population. The critical question is whether those inferences are trustworthy, and the answer depends almost entirely on how the sample was selected.
Random Selection
Bias vs. Variability
Sampling Frame
Generalizability
Sources of Bias
KEY TAKEAWAY
SECTION 3
Visual Explanation — Sampling Methods Overview
The diagram below illustrates the four major probability sampling methods you must know for the AP Statistics exam. Each method uses randomness differently to select individuals from a population, and each has distinct advantages depending on the structure of the population and the practical constraints of the study.
Notice the fundamental distinction among the probability methods. In a simple random sample, every possible sample of size n has an equal chance of being chosen—this is the purest form of random selection. Stratified random sampling first classifies the population into non-overlapping subgroups (strata) based on a characteristic expected to influence the response, then draws a separate SRS from each stratum—this guarantees representation from every group and typically reduces variability. Cluster sampling randomly selects entire groups (clusters) and then surveys every individual within the chosen clusters—this is practical when a complete list of individuals is unavailable but a list of clusters is. Systematic sampling selects a random starting point and then picks every kth individual from an ordered list, which is efficient but can be biased if the list has a periodic pattern aligned with k.
 The way people or groups enter a study determines its design. Sampling within groups, selecting whole groups and assigning treatments answer different questions.
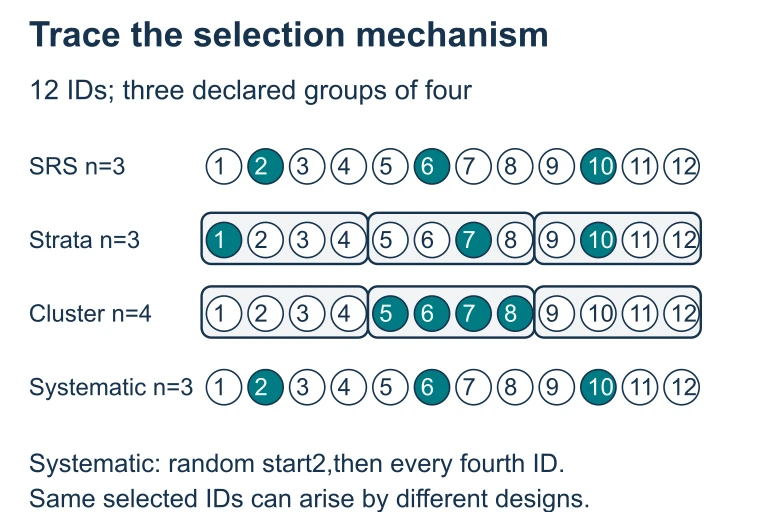 The 12-ID examples use different selection rules: an SRS selects from the whole list; stratification selects within every group; cluster sampling takes all IDs in the chosen group; systematic sampling uses a random start and fixed spacing. The selection rule, not a single realized sample, identifies the design.
SECTION 4
Mathematical Framework
While the AP Statistics exam does not require you to derive sampling distributions from first principles, understanding the mathematical relationships between sample size, variability, and margin of error gives you the conceptual foundation for the inference procedures you will encounter throughout the course. The formulas below connect the mechanics of random sampling to the quantitative measures of precision that make statistical inference possible.
MARGIN OF ERROR (PROPORTIONS)
where z* is the critical value for the desired confidence level, p̂ is the sample proportion, and n is the sample size. Notice that the margin of error decreases with the square root of n—quadrupling the sample size halves the margin of error.
SELECTION PROBABILITY (SRS)
In a simple random sample of size n from a population of size N, every individual has the same probability of being included. This equal probability is what allows us to compute unbiased estimators of population parameters.
SYSTEMATIC SAMPLING INTERVAL
Choose a random starting point between 1 and k, then select every kth individual. For example, from a population of N = 5000, a sample of n = 100 requires k = 50, so you might start at individual 23 and then select 73, 123, 173, and so on.
NUMBER OF POSSIBLE SRS SAMPLES
The combination formula gives the total number of distinct samples of size n from a population of size N. An SRS ensures each of these C(N, n) samples is equally likely. Even for modest populations, this number is astronomically large, which is why random selection is so powerful: bias would require systematically avoiding certain combinations.
WHY SAMPLE SIZE MATTERS (BUT NOT AS MUCH AS YOU THINK)
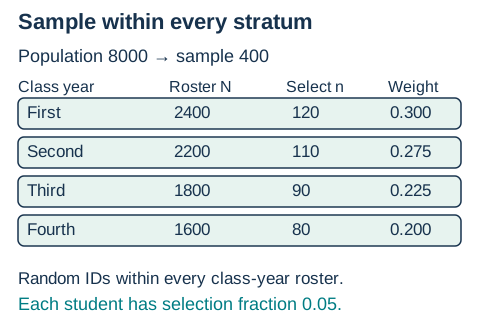 For a university with 8,000 students, allocate 400 selections as 120, 110, 90 and 80 across the four class-year rosters, then choose random IDs within each roster. Each student has a 5% selection chance; the fixed class-year allocations make this a stratified sample, not an SRS of 400.Open full diagram
SECTION 5
Sources of Bias in Data Collection
Even a well-designed sampling plan can be undermined by bias that creeps in during the data-collection process. The AP Statistics exam frequently tests your ability to identify and distinguish among several types of bias. The diagram below organizes these sources into a decision flowchart that traces where in the sampling pipeline each type of bias can occur.
| Type of Bias | Definition | Classic Example |
|---|---|---|
| Undercoverage | Some members of the population are left out of the sampling frame | Phone survey using landlines only excludes cell-phone-only households |
| Voluntary Response | Individuals self-select into the sample, typically those with strong opinions | Online product reviews skew negative because dissatisfied customers are more motivated to post |
| Nonresponse | Selected individuals cannot be contacted or refuse to participate | Mailed health survey has 20% response rate; respondents may be healthier than non-respondents |
| Response Bias | Respondents give inaccurate answers due to question wording, interviewer influence, or social desirability | Asking "Don't you agree that..." leads respondents toward a particular answer |
| Convenience Sampling | Researcher selects whoever is most accessible, with no randomization | Surveying students in the library about study habits over-represents studious individuals |
Common sources of bias tested on the AP Statistics exam
AP Exam Tip
SECTION 6
Worked Example — Designing a Sampling Plan
A school district with 12 elementary schools (total enrollment 4,800 students) wants to estimate the proportion of students who eat breakfast every morning. The district has a complete roster of all students organized by school. Design a stratified random sampling plan and explain why it is preferable to a simple random sample in this context.
Designing a Stratified Random Sample
- 1
Step 1 — Identify the Population and Parameter
The population is all 4,800 elementary students in the district. The parameter of interest is p, the true proportion of students who eat breakfast every morning.Population: 4,800 students across 12 schools - 2
Step 2 — Define the Strata
Because breakfast habits may vary by school (due to differences in socioeconomic composition, proximity to restaurants, or school breakfast programs), we use each of the 12 schools as a stratum. This ensures that every school is represented in the final sample and reduces variability by accounting for school-to-school differences.12 strata, one per school - 3
Step 3 — Determine Sample Size and Allocation
Suppose we want a total sample of n = 240 students (5% of the population). Using proportional allocation, each school contributes students in proportion to its enrollment. For example, a school with 600 students (600/4800 = 12.5% of the population) contributes 0.125 × 240 = 30 students to the sample.n = 240 total; proportional allocation per school - 4
Step 4 — Random Selection Within Each Stratum
Within each school, assign every student a number (e.g., 001–600 for the school above). Use a random number generator or a table of random digits to select the required number of students. Each student within a school has an equal probability of being selected. This process is repeated independently for each of the 12 schools.SRS within each stratum using random number generator - 5
Step 5 — Justify the Method Over SRS
A simple random sample of 240 from 4,800 might, by chance, over-represent some schools and miss others entirely. By stratifying, we guarantee representation from every school and reduce the variability of our estimate because within-school variability in breakfast habits is likely smaller than between-school variability. The result is a more precise estimate of the district-wide proportion for the same sample size.Stratified sampling is more precise because it ensures representation and exploits within-stratum homogeneity.
SECTION 7
Comparing Sampling Methods — Strengths & Limitations
Each sampling method involves tradeoffs between statistical precision, practical feasibility, and cost. The table below summarizes the strengths and limitations you should be prepared to discuss on the AP exam. Understanding these tradeoffs is essential for free-response questions that ask you to select and justify a sampling design for a given scenario.
| Method | Strengths | Limitations |
|---|---|---|
| Simple Random Sample (SRS) | Eliminates selection bias; every sample of size n equally likely; simplest to analyze; foundation for all other methods | Requires a complete list of the population; may be impractical for geographically dispersed populations; can miss small subgroups by chance |
| Stratified Random Sample | Guarantees representation of all subgroups; typically more precise than SRS for the same n; allows separate analysis of each stratum | Requires advance knowledge of a relevant stratifying variable; requires a complete list within each stratum; more complex to administer |
| Cluster Sample | Does not require a list of every individual—only a list of clusters; cost-effective for geographically spread populations; practical for large-scale studies | Higher variability than SRS or stratified for the same n; biased if clusters are not representative; selected clusters may share unique characteristics |
| Systematic Sample | Easy to implement; spreads sample evenly across the ordered list; does not require labeling every individual in advance | Biased if the list has a periodic pattern matching k; technically not an SRS (not every combination of n individuals is equally likely) |
Comparison of the four probability sampling methods
STRATIFIED ≠ CLUSTER — A CRITICAL DISTINCTION
SECTION 8
Connection to Statistical Inference
Everything you learn about random sampling in Unit 4 of AP Statistics exists to support the inference procedures you will encounter in Units 6–9. The connection is direct: confidence intervals and hypothesis tests are valid only when the data come from a well-designed random sample or randomized experiment. Without random selection, the sampling distribution—the theoretical framework that underlies every p-value and confidence interval—does not apply, and your conclusions have no guaranteed connection to the population.
| Data Collection Concept | Inference Consequence |
|---|---|
| Random sampling from population | Results can be generalized to the entire population from which the sample was drawn |
| Random assignment to treatments | Cause-and-effect conclusions can be drawn about the treatments |
| Both random sampling AND random assignment | Causal conclusions can be generalized to the population—the gold standard |
| Neither random sampling nor random assignment | No generalization and no causal claims—only associations within the observed sample |
The Scope of Conclusions framework — essential for AP exam free-response
This framework is sometimes called the Scope of Conclusions table, and it appears frequently on AP free-response questions. When you write conclusions for inference problems, your language must match the study design. If a study used random sampling but not random assignment, you may generalize to the population (e.g., "we can estimate the proportion of all students who...") but you may not claim causation. Conversely, an experiment with random assignment but convenience sampling can establish causation within the sample but cannot generalize to a broader population.
Looking Ahead
SECTION 9
Practice Problems
Question 1: CONCEPTUAL
- A. The sample size of 800 is too small relative to the population of 5,000.
- B. The sample may suffer from voluntary response bias because employees choose whether to respond, and those with extreme commute times may be more motivated to participate.
- C. The sampling frame does not match the population because not all employees have internet access.
- D. The researcher should have used a census instead of a sample.
- E. The results cannot be analyzed because the sample was not stratified by department.
Show answer (B)
Question 2: BASIC CALCULATION
- A. 20
- B. 50
- C. 100
- D. 200
- E. 500
Show answer (B)
Question 3: INTERMEDIATE
- A. Stratified random sample; a drawback is that it requires a complete list of all fourth-graders.
- B. Simple random sample; a drawback is that some schools may be over-represented.
- C. Cluster sample; a drawback is that schools selected by chance may not represent the full diversity of schools in the state, increasing variability.
- D. Systematic sample; a drawback is that periodic patterns in the school list could introduce bias.
- E. Convenience sample; a drawback is that the agency chose schools that were easy to access.
Show answer (C)
Question 4: APPLIED
4 ptsShow answer
Question 5: CRITICAL THINKING
4 ptsShow answer
SUMMARY
Random Sampling and Data Collection — Summary
Summary
Valid statistical inference begins with proper data collection. Random sampling ensures that every member of the population has a known, non-zero chance of selection, which eliminates selection bias and provides the mathematical foundation for computing margins of error and constructing confidence intervals. The four probability sampling methods—simple random, stratified random, cluster, and systematic—each use randomness in a different way and offer distinct tradeoffs between precision, cost, and practicality.
Beyond the selection mechanism, you must be vigilant about sources of bias that can corrupt data at every stage of the collection pipeline: undercoverage when the sampling frame misses population members, nonresponse bias when selected individuals fail to participate, voluntary response bias when individuals self-select, and response bias when question wording or social desirability distorts answers. Remember the Scope of Conclusions framework: random sampling allows generalization to the population, random assignment allows causal claims, and you need both for generalizable causal conclusions. Increasing sample size reduces variability but never fixes bias—only sound design can do that.