

SECTION 1
Historical Context & Motivation
Statistical sampling has a storied history of spectacular failures that illuminate why careful methodology matters. One of the most famous disasters in survey history occurred in 1936, when The Literary Digest magazine mailed out over ten million questionnaires to predict the outcome of the presidential election between Franklin D. Roosevelt and Alf Landon. The magazine predicted a Landon landslide, yet Roosevelt won by one of the largest margins in American electoral history. The root cause was not a small sample—indeed, over two million responses were collected—but rather a deeply flawed sampling frame that overrepresented affluent Americans who were more likely to favor the Republican candidate. This episode powerfully demonstrates that sample size alone does not guarantee accuracy; the method by which the sample is drawn is equally, if not more, important.
1936 • The Literary Digest Polling Disaster
1948 • Dewey Defeats Truman
1970s • Rise of Telephone Surveys
2016 • Modern Polling Challenges
These historical episodes raise a fundamental question in statistics: even when we intend to collect data that faithfully represents a population, what can go wrong between our sampling plan and the conclusions we draw? Understanding the sources of sampling problems is essential because flawed data collection undermines every subsequent analysis, no matter how sophisticated the statistical techniques applied. In this lesson, we systematically examine the types of bias and error that can compromise a sample and learn to identify, diagnose, and—where possible—mitigate these threats.
SECTION 2
Core Principles & Definitions
Before diagnosing specific problems, it is critical to distinguish between two broad categories of error that affect any survey or study. Sampling error refers to the natural variability that arises because we observe only a subset of the population rather than conducting a census; it is expected, quantifiable, and decreases as sample size increases. Non-sampling error, by contrast, encompasses all other mistakes—faulty sampling frames, biased wording, nonresponse, measurement problems—and these errors do not shrink with larger samples. In fact, enlarging a biased sample merely produces a more precise wrong answer. The AP Statistics exam places heavy emphasis on identifying and explaining non-sampling errors, and these form the core of what we mean by "potential problems with sampling."
Bias
Undercoverage
Nonresponse Bias
Voluntary Response Bias
Response Bias
KEY TAKEAWAY
SECTION 3
Visualizing Sampling Problems
The following diagram illustrates how different types of bias distort the relationship between a population and the sample that is actually analyzed. In an ideal scenario, the sampling frame perfectly matches the population, every selected individual responds, and every response accurately reflects reality. Each type of bias represents a breakdown at a different stage of this pipeline, and recognizing where the breakdown occurs is the key to diagnosing and naming the bias correctly on the AP exam.
Notice that the pipeline has multiple stages, and bias can enter at any one of them—or at several simultaneously. A survey might suffer from both undercoverage (the sampling frame excludes certain demographics) and nonresponse bias (those who are contacted disproportionately refuse to participate). When answering AP exam questions, you should identify the specific stage at which bias enters and name it precisely; saying a sample is simply "biased" without specifying the type and direction will not earn full credit.
SECTION 4
How Bias Distorts Estimation
Although many sampling problems are conceptual rather than computational, it is useful to formalize how bias and variability jointly determine the accuracy of a sample statistic. The total survey error framework decomposes the difference between a sample statistic and the true population parameter into systematic and random components. Understanding this decomposition clarifies why increasing sample size does not remedy bias.
MEAN SQUARED ERROR DECOMPOSITION
Where θ̂ is the sample statistic, Bias(θ̂) = E(θ̂) − θ is the systematic deviation from the true parameter θ, and Var(θ̂) is the sampling variability. Increasing n reduces Var(θ̂) but does not affect Bias(θ̂).
MARGIN OF ERROR (FOR PROPORTIONS)
The margin of error quantifies only random sampling variability. It does NOT account for bias. A survey with a ±3% margin of error can still be off by 15% or more if systematic bias is present.
This distinction is crucial for interpreting confidence intervals on the AP exam. When a problem states that a 95% confidence interval for a proportion is (0.42, 0.48), the interval accounts for sampling variability but implicitly assumes that the sample was collected without systematic bias. If the sampling method was flawed—say, a voluntary response internet poll—then the true parameter might lie well outside the reported interval, regardless of its width. The confidence level of 95% applies to the repeated-sampling probability of capturing θ only when the sampling procedure is unbiased.
AP EXAM TIP
SECTION 5
Detailed Classification of Sampling Problems
The AP Statistics curriculum identifies several distinct categories of problems that can compromise a sample. While they share the common feature of introducing systematic error, each has a unique mechanism and requires a different remedy. The diagram below provides a classification tree that can help you quickly identify which type of bias is present in an exam scenario.
| Type of Bias | When It Occurs | Classic Example | Likely Direction |
|---|---|---|---|
| Undercoverage | The sampling frame omits part of the population | A telephone survey that excludes cell-phone-only households, underrepresenting younger adults | Depends on how the excluded group differs from those included |
| Voluntary Response | Individuals self-select into the sample | An online restaurant review site where only customers with extreme experiences bother to post | Overrepresents strong (often negative) opinions |
| Nonresponse | Selected individuals refuse or fail to respond | A mailed health survey where sicker individuals are too ill to complete and return it | Depends on how nonrespondents differ from respondents |
| Response (Wording) | Question wording pushes answers in a particular direction | "Don't you agree that taxes are too high?" leads respondents toward agreement | Toward the implied "correct" answer |
| Response (Social Desirability) | Respondents give socially acceptable rather than truthful answers | A face-to-face survey about drug use where respondents underreport illegal behavior | Overestimates "good" behaviors, underestimates "bad" ones |
Summary of the five major types of bias tested on the AP Statistics exam
 A survey can lose people before selection or after invitation. Keeping the target population, sampling frame, selected sample and respondents separate reveals where each problem arises.
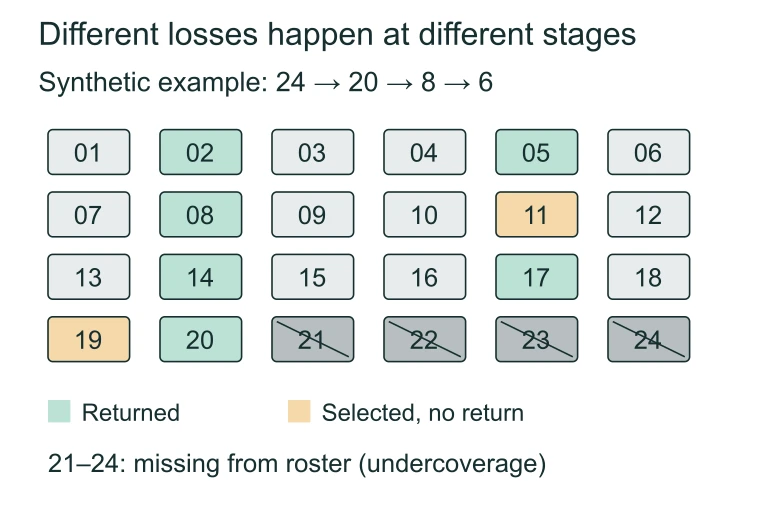 Suppose the target population has 24 IDs. The frame omits IDs 21–24; eight listed IDs are selected, and six respond. Frame omissions are undercoverage; selected people who do not respond are nonresponse. Bias direction depends on how missing responses differ.
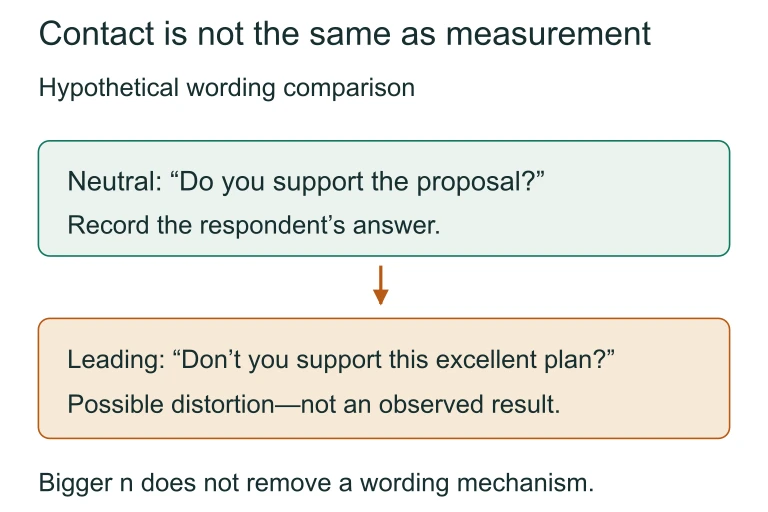 A respondent can still be influenced by the wording of a question. Compare the neutral and leading versions by identifying the assumption each asks the respondent to accept.
SECTION 6
Worked Example: Identifying and Explaining Bias
Consider the following scenario, which is typical of what you would encounter on an AP Statistics free-response question: A school principal wants to estimate the proportion of students who have been bullied in the past year. She places a box in the main office with slips of paper for students to voluntarily report whether they have been bullied. After one month, she collects the slips and finds that 72% of respondents report being bullied. She concludes that bullying is a severe problem at her school. Identify all potential problems with this sampling method and explain how each could affect the conclusion.
Diagnosing Bias in a School Bullying Survey
- 1
Step 1 — Identify the Sampling Method
The principal placed a box in the office and allowed students to voluntarily deposit slips. No random selection mechanism was used. This is a voluntary response sample, not a probability sample.Sampling method: Voluntary response - 2
Step 2 — Identify Voluntary Response Bias
Students who have been bullied are more likely to feel strongly about the issue and are therefore more motivated to take the time to fill out a slip and drop it in the box. Students who have not been bullied have little reason to participate. As a result, the sample likely overrepresents bullied students.Direction: Overestimates the true proportion of bullied students - 3
Step 3 — Identify Potential Undercoverage
The box is located only in the main office. Students who rarely visit the office—perhaps those in certain grades, extracurricular programs, or those who avoid the office for personal reasons—have effectively zero probability of being included. This is undercoverage, and if the excluded students have different bullying experiences, the result is biased.Additional bias: Undercoverage of students who do not visit the main office - 4
Step 4 — Identify Potential Response Bias
The slips are not anonymous in a guaranteed way—students might worry that office staff could identify them. If students fear retaliation for reporting bullying or feel embarrassed, some may underreport, introducing response bias due to social desirability. This could work against the voluntary response bias, but the net effect is uncertain.Possible response bias: Underreporting due to fear of identification - 5
Step 5 — State the Conclusion
The principal's estimate of 72% is almost certainly an overestimate of the true proportion of bullied students because voluntary response bias is the dominant problem here. The result cannot be generalized to the entire student body because the sample is not representative. A better approach would be to use a simple random sample of students selected from the school enrollment list, with an anonymous questionnaire administered during class to maximize the response rate.72% likely overestimates the true bullying rate; no valid generalization is possible
SECTION 7
Remedies and Mitigation Strategies
Knowing how to identify bias is essential, but a strong understanding of sampling problems also includes knowledge of how to prevent or mitigate them. The table below summarizes the primary remedies for each type of bias. On the AP exam, you may be asked not only to identify what went wrong but to propose an improved sampling design.
| Problem | Primary Remedy | Why It Works |
|---|---|---|
| Undercoverage | Use a comprehensive, up-to-date sampling frame; consider stratification to ensure all subgroups are represented | A complete frame ensures every member of the population has a known, nonzero probability of selection |
| Voluntary Response | Replace with a probability sampling method (SRS, stratified, cluster, or systematic) | Probability sampling removes self-selection, giving the researcher control over who is included |
| Nonresponse | Follow up persistently with nonrespondents; offer incentives; keep surveys short and convenient | Higher response rates reduce the gap between respondents and nonrespondents, minimizing potential bias |
| Response Bias (Wording) | Use neutral, balanced question wording; pilot-test the instrument; avoid leading or loaded language | Neutral wording reduces the likelihood that the question itself pushes respondents toward a particular answer |
| Response Bias (Social Desirability) | Guarantee anonymity; use self-administered questionnaires rather than face-to-face interviews for sensitive topics | Anonymity removes the social pressure that causes respondents to shade their answers toward what is deemed acceptable |
Remedies for common sources of bias in sampling
KEY TAKEAWAY
SECTION 8
Connection to Inference and Advanced Topics
Sampling problems do not exist in isolation; they directly affect the validity of every inferential procedure you will learn in AP Statistics. When you construct a confidence interval or perform a hypothesis test, the formulas assume that the data were collected using a method that gives every individual (or at least identifiable groups) a known probability of selection. The conditions for inference—randomness, independence, normality—begin with the randomness condition, which is impossible to satisfy if the sample was collected via a flawed method. The table below connects the sampling problems covered in this lesson to the inferential concepts you will encounter later in the course.
| Sampling Problem | Effect on Inference |
|---|---|
| Undercoverage | The confidence interval or test result applies only to the covered population, not the target population. Generalization is invalid. |
| Voluntary Response | The randomness condition is violated. No confidence interval or p-value is meaningful because the sample does not represent any well-defined population. |
| Nonresponse Bias | The effective sample is no longer random even if the original selection was. The margin of error understates the true uncertainty. |
| Response Bias | The data values themselves are distorted. Even a perfectly random sample produces biased estimates if the measurements are systematically off. |
How sampling problems propagate into later inferential procedures
In more advanced statistics courses and in professional survey methodology, researchers use techniques such as post-stratification weighting, propensity score adjustment, and multiple imputation to partially correct for known biases after data collection. However, these methods require strong assumptions and are imperfect substitutes for good sampling design. The fundamental lesson remains: the best defense against bias is a well-designed probability sampling plan executed with rigorous follow-up procedures to minimize nonresponse. Prevention is always preferable to correction.
SECTION 9
Practice Problems
Question 1: CONCEPTUAL
- A. The sample size of 230 is too small to construct a valid confidence interval.
- B. The margin of error will be larger than if all 1,000 had responded.
- C. People who exercise more may be more likely to respond, making the results systematically too high.
- D. A census of all households in the area should have been conducted instead.
- E. The original 1,000 households were not enough to represent the population.
Show answer (C)
Question 2: BASIC CALCULATION
- A. Response bias due to question wording
- B. Undercoverage bias because not all parents use social media
- C. Sampling error due to the sample being too small
- D. Voluntary response bias because parents self-selected into the survey
- E. Nonresponse bias because many parents chose not to participate
Show answer (D)
Question 3: INTERMEDIATE
- A. The poll likely overestimates support for the candidate.
- B. The poll likely underestimates support for the candidate.
- C. The poll is unbiased because the dialing was random.
- D. The direction of the bias cannot be determined from the information given.
- E. The bias is due to nonresponse rather than undercoverage.
Show answer (B)
Question 4: APPLIED
4 ptsShow answer
Question 5: CRITICAL THINKING
4 ptsShow answer
SUMMARY
Lesson Summary
Summary
Sampling problems fall into two broad categories: sampling error, which is the natural random variability inherent in any sample and decreases with larger sample sizes, and non-sampling error (bias), which is systematic and cannot be reduced by increasing the sample size. The major types of bias include undercoverage (parts of the population are excluded from the sampling frame), voluntary response bias (individuals self-select into the sample, overrepresenting those with strong opinions), nonresponse bias (selected individuals fail to participate and differ from those who do), and response bias (respondents give inaccurate answers due to leading questions, social desirability, or interviewer effects).
For the AP Statistics exam, always remember the three-part framework for addressing bias: (1) name the type of bias, (2) explain the mechanism by which it arises, and (3) state the direction (overestimate or underestimate). The gold standard remedy is probability sampling—simple random samples, stratified random samples, and cluster samples—combined with vigorous follow-up to minimize nonresponse. Remember that the margin of error reported with a confidence interval quantifies only sampling variability, not bias; a biased sample can produce a confidence interval that entirely misses the true parameter.