

SECTION 1
Historical Context & Motivation
The need for rigorous study design grew out of centuries of scientific inquiry in which poorly collected data led to misleading or outright incorrect conclusions. In the early history of medicine, for example, physicians routinely prescribed treatments based on anecdotal observations and personal conviction rather than systematic evidence. Agriculture faced similar challenges: farmers debated the merits of different fertilizers without any controlled method for determining which truly improved crop yields. The formalization of statistical study planning emerged when researchers recognized that how data are collected is just as important as how data are analyzed. This section traces the key milestones that shaped the modern approach to planning studies, from early census efforts to the randomized controlled trial.
1747 • Lind's Scurvy Trial
1920s • Fisher's Agricultural Experiments
1948 • Streptomycin RCT
1970s–Present • Expansion Across Disciplines
The central question that study planning addresses is deceptively simple: What kind of evidence do we need, and how should we collect it, to answer a specific question reliably? Without a clear answer to this question before data collection begins, even the most sophisticated analysis techniques cannot rescue a flawed study. The remainder of this lesson explores the principles, structures, and decisions that underpin effective study planning in statistics.
SECTION 2
Core Principles & Definitions
Planning a study requires a clear understanding of several foundational concepts that determine the type of study you conduct, the conclusions you can draw, and the population to which those conclusions apply. At the broadest level, every statistical investigation begins with a research question—a precisely stated inquiry that the study is designed to answer. The nature of that question dictates whether you need an observational study or an experiment. Understanding the distinction between these two broad categories—and the further subtypes within each—is arguably the single most important idea in the AP Statistics data-collection unit.
Observational Study vs. Experiment
Population & Sample
Confounding Variables
Scope of Inference
KEY TAKEAWAY
SECTION 3
Visual Overview: The Study Planning Framework
The diagram below provides a comprehensive visual map of the decision-making process that underlies planning a statistical study. Starting from a research question, the flowchart distinguishes the two main study types and highlights the key design elements associated with each. Understanding this branching structure is essential for the AP Statistics exam, where you will frequently be asked to identify the type of study, evaluate its design, and determine the scope of valid conclusions.
Notice that the diagram distinguishes between two types of randomness that often confuse students. Random selection (choosing who is in the study from the population) supports generalizability—the ability to extend conclusions to the broader population. Random assignment (deciding who receives which treatment within the study) supports causal inference—the ability to attribute differences in the response to the treatment itself. A study can have one, both, or neither of these features, and the scope of inference changes accordingly.
SECTION 4
How Study Design Determines Valid Conclusions
While the "Collecting Data" unit of AP Statistics is less equation-heavy than inference or probability, there is a rigorous logical framework that governs how study design maps onto the conclusions you may legitimately draw. The relationship between design features and inferential scope can be organized into a 2 × 2 scope-of-inference matrix, which is one of the most tested conceptual structures on the AP exam.
| Random Assignment (Yes) | No Random Assignment | |
|---|---|---|
| Random Selection (Yes) | Causal conclusions generalizable to the population. This is the ideal scenario—an experiment with a randomly selected sample. | Association conclusions generalizable to the population. Observational study with a representative sample. |
| No Random Selection | Causal conclusions limited to subjects in the study. A common experimental scenario where volunteers are used. | No causal or generalizable conclusions. A convenience sample with no random assignment offers the weakest evidence. |
The 2 × 2 Scope-of-Inference Matrix
The matrix above is not a formula to memorize; it is a logical consequence of what randomness accomplishes. Random selection ensures that the sample reflects the population, so findings can be generalized outward. Random assignment balances both known and unknown confounding variables across treatment groups, so any observed difference in the response variable can be attributed to the treatment rather than to lurking variables. When a study lacks one or both forms of randomness, the corresponding inferential claim—generalizability or causation—is no longer supported.
AP Exam Tip
Confounding: The Key Threat to Causal Inference
A confounding variable is a variable that is associated with both the explanatory variable and the response variable, creating an alternative explanation for the observed relationship. In an observational study comparing coffee drinkers to non-coffee drinkers on anxiety levels, for instance, stress could be a confounder: high-stress individuals may drink more coffee and experience more anxiety, making it unclear whether coffee itself drives the association. Random assignment in an experiment disrupts confounding by distributing all variables—measured or unmeasured—roughly equally across groups. This is why only well-designed experiments can support causal claims.
SECTION 5
Classifying Studies: A Detailed Breakdown
Within the two broad categories of observational studies and experiments, several subtypes appear regularly on the AP Statistics exam. Understanding the characteristics of each subtype helps you identify study designs in context and anticipate the strengths and limitations that follow.
A sample survey collects information from respondents at a single point in time, typically through questionnaires or interviews. It is perhaps the most common form of observational study and is subject to biases such as nonresponse and wording effects. A prospective study follows a group of subjects forward in time, recording exposures and outcomes as they develop; this approach is stronger than a retrospective design because it can track the temporal sequence of events. A retrospective study looks backward, mining existing records or asking subjects to recall past behavior—useful when the outcome has already occurred but susceptible to recall bias.
On the experimental side, a completely randomized design (CRD) is the simplest structure: all subjects are randomly allocated to treatment groups without any preliminary grouping. A randomized block design first organizes subjects into blocks based on a variable that is expected to affect the response (such as age group or gender), and then randomly assigns treatments within each block. This reduces variability and increases the precision of comparisons. A matched pairs design is a special case of blocking in which each block contains exactly two subjects who are matched on relevant characteristics, or a single subject who receives both treatments in random order.
 The top shelf receives more light than the lower shelf. Place both fertilizer treatments on each shelf, control watering, soil and pot size, and measure height increase over four weeks.
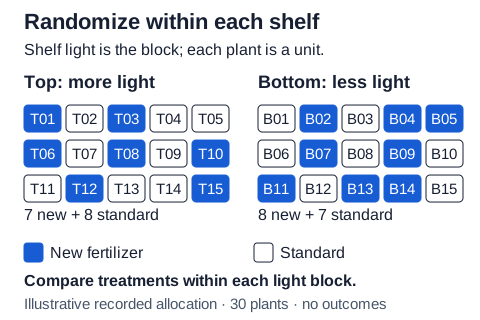 For 30 seedlings, form two 15-plant shelf blocks and randomize both fertilizers within each shelf. The shown allocation assigns 7 new and 8 standard on top, 8 new and 7 standard below. Compare treatment growth within shelves so the light difference stays in the analysis.Open full diagram
SECTION 6
Worked Example: Identifying and Evaluating a Study Design
Consider the following scenario, which mirrors the kind of prompt you would encounter on the AP Statistics free-response section.
Scenario
Analyzing the Study Design
- 1
Step 1 — Identify the Study Type
The researchers imposed a treatment (using the meditation app) on the treatment group. Because a treatment was deliberately applied, this is an experiment, not an observational study.Study type: Experiment - 2
Step 2 — Identify the Experimental Design
All 120 volunteers were randomly assigned to one of two groups without any preliminary grouping by a blocking variable. This means the design is a completely randomized design (CRD) with two treatment groups.Design: Completely Randomized Design - 3
Step 3 — Identify Key Components
The explanatory variable (factor) is whether or not the student uses the meditation app. The response variable is the self-reported stress score on the questionnaire. The experimental units are the 120 first-year student volunteers. The treatments are (1) daily use of the meditation app and (2) continuing normal routines (the control).Explanatory: app usage; Response: stress score; Units: 120 students; Treatments: app vs. control - 4
Step 4 — Assess Random Selection vs. Random Assignment
The students were volunteers, not a random sample from all first-year students. This means random selection was not used. However, random assignment was used to place students into treatment groups.Random selection: No. Random assignment: Yes. - 5
Step 5 — Determine the Scope of Inference
Because random assignment was used, we can draw a causal conclusion: if a statistically significant difference is found, we can say the meditation app caused a reduction in stress. However, because random selection was not used (participants were volunteers), we cannot generalize the results beyond the 120 volunteers to all first-year students at the university.Causation: Yes (for these volunteers). Generalization: No (volunteers only).
SECTION 7
Strengths & Limitations of Each Study Type
No single study type is universally superior. The choice between observational and experimental designs depends on the research question, ethical constraints, available resources, and the population of interest. Recognizing the relative strengths and limitations of each approach is critical both for the AP exam and for evaluating real-world research.
| Feature | Observational Study | Experiment |
|---|---|---|
| Causal Inference | Cannot establish causation; confounders remain uncontrolled. | Can establish causation when random assignment is used. |
| Ethical Feasibility | Often the only option when imposing a treatment would be unethical (e.g., smoking, exposure to toxins). | Limited to situations where treatment can be ethically imposed. |
| Generalizability | Can use random sampling from a large population, supporting strong generalizability. | Often uses volunteers, limiting generalizability. |
| Cost & Time | Retrospective studies are inexpensive; prospective studies can be lengthy. | Controlled conditions can be costly and time-intensive to maintain. |
| Control of Confounders | Relies on statistical techniques (e.g., stratification) to address confounders. | Random assignment balances both known and unknown confounders. |
Comparison of Observational Studies and Experiments
KEY TAKEAWAY
SECTION 8
Connection to Inference and Advanced Design
The principles introduced in this lesson lay the groundwork for every inference procedure you will encounter later in AP Statistics. When you perform a two-sample t-test or construct a confidence interval for a difference in proportions, the validity of those procedures depends on how the data were collected. A well-designed experiment with random assignment allows you to test the null hypothesis that the treatment has no effect, while a well-designed sample survey allows you to construct confidence intervals that apply to the population. Conversely, when study design is flawed, no amount of inferential machinery can fix the resulting bias.
| Concept in This Lesson | Advanced Connection |
|---|---|
| Random assignment → causal conclusions | Permutation tests and randomization distributions simulate what would happen under the null hypothesis if the treatment had no effect, directly leveraging the logic of random assignment. |
| Random selection → generalization | Confidence intervals for population parameters (μ, p) assume the sample is representative of the population, which random selection ensures. |
| Blocking in experiments | Stratified random sampling in surveys uses the same logic: group similar units together to reduce variability and increase precision. |
| Confounding variables | In regression analysis, lurking and confounding variables motivate the inclusion of additional predictors in multiple regression models to isolate the effect of each variable. |
How Study Planning Concepts Connect to Later Topics
Looking beyond AP Statistics, advanced courses in biostatistics and econometrics formalize these ideas further. Quasi-experimental designs—such as regression discontinuity and difference-in-differences—attempt to approximate the benefits of randomization when true experiments are infeasible. Meta-analyses synthesize findings across many studies, weighting each study partly by the rigor of its design. The fundamental question remains the same one you are learning to ask now: Given how these data were collected, what conclusions are justified?
SECTION 9
Practice Problems
Question 1: CONCEPTUAL
- A. Eating more fruits and vegetables causes a lower BMI.
- B. There is a positive association between fruit and vegetable intake and BMI in the population.
- C. There is a negative association between fruit and vegetable intake and BMI, and this result can be generalized to the population.
- D. There is a negative association between fruit and vegetable intake and BMI, but this result applies only to the 500 adults in the study.
- E. A causal relationship exists and can be generalized to all adults.
Show answer (C)
Question 2: BASIC CALCULATION
- A. Observational study with random selection
- B. Experiment with a completely randomized design
- C. Experiment with a matched pairs design
- D. Experiment with a randomized block design
- E. Observational study because the teacher already has the students in her class
Show answer (B)
Question 3: INTERMEDIATE
- A. Randomized block design; blocking variable is fertilizer type; causation can be established and generalized.
- B. Completely randomized design; no blocking variable; causation can be established for these plots only.
- C. Randomized block design; blocking variable is sun exposure; causation can be established for these 40 plots, but not generalized to a larger population of plots.
- D. Matched pairs design; blocking variable is sun exposure; causation can be established and generalized.
- E. Randomized block design; blocking variable is sun exposure; only association can be established because this is an observational study.
Show answer (C)
Question 4: APPLIED
4 ptsShow answer
Question 5: CRITICAL THINKING
4 ptsShow answer
SUMMARY
Summary
Summary
Planning a study is the foundational step of any statistical investigation. Every study begins with a clearly stated research question that determines whether an observational study or an experiment is appropriate. In observational studies—including sample surveys, prospective studies, and retrospective studies—the researcher records data without imposing a treatment, and conclusions are limited to association because confounding variables cannot be ruled out.
In experiments—such as completely randomized designs, randomized block designs, and matched pairs designs—random assignment of treatments enables causal conclusions by balancing confounders across groups. The scope of inference depends on two independent features: random selection supports generalization to the population, while random assignment supports causal inference. Mastering the 2 × 2 scope-of-inference matrix and being able to identify, evaluate, and critique study designs are essential skills for success on the AP Statistics exam.