

SECTION 1
Historical Context & Motivation
For centuries, scientists relied on passive observation to draw conclusions about the natural world, but observation alone could never definitively separate cause from coincidence. The need for a rigorous, structured method of testing hypotheses gave rise to experimental design — the systematic practice of deliberately manipulating one or more factors while holding others constant so that any observed effect can be attributed to the manipulation itself rather than to lurking variables. The development of formal experimental design transformed statistics from a tool of description into a powerful engine of causal inference, and its principles now underpin research in medicine, agriculture, psychology, engineering, and virtually every empirical discipline.
1747 • Lind's Scurvy Trial
1835 • Placebo-Controlled Testing
1925 • Fisher's Foundational Work
1948 • First Randomized Clinical Trial
2000s–Present • Modern Adaptive Designs
The central question that experimental design addresses is deceptively simple: How can we determine whether changes in one variable actually cause changes in another? Observational studies can reveal associations and correlations, but they cannot, by themselves, rule out the influence of confounding variables. Only a well-designed experiment — with deliberate manipulation, proper controls, and random assignment — can close the gap between correlation and causation. Understanding these principles is essential not only for the AP Statistics exam but for critically evaluating the scientific claims you encounter throughout your academic and professional life.
SECTION 2
Core Principles & Definitions
An experiment differs from an observational study in one critical way: the researcher deliberately imposes a treatment on the experimental units to observe a response. The vocabulary of experimental design is precise, and mastering it is the first step toward designing and critiquing studies. The explanatory variable (also called the factor) is the variable the researcher manipulates; the specific values of the factor are called levels. The response variable is the outcome measured after the treatment is applied, and the experimental units are the individuals or objects to which treatments are applied (when these are people, we call them subjects). A treatment is a specific combination of factor levels imposed on the experimental units.
Control
Randomization
Replication
Blocking (Optional but Powerful)
KEY TAKEAWAY
SECTION 3
Visual Explanation — Anatomy of an Experiment
The following diagram illustrates the general structure of a completely randomized design — the most fundamental experimental layout. Experimental units are first collected, then randomly assigned to treatment groups (including the control group), treatments are applied, and finally responses are measured and compared. This visual framework applies to experiments across every discipline, from pharmaceutical trials to agricultural field studies.
Notice that the random assignment step is the critical juncture in the diagram. Without it, pre-existing differences among the experimental units might systematically favor one treatment group over another — a problem known as confounding. A confounding variable is a variable associated with both the explanatory variable and the response variable, making it impossible to determine which one is truly responsible for the observed effect. Randomization does not eliminate confounding variables; rather, it distributes their effects evenly across all treatment groups so that they cannot systematically bias the comparison.
SECTION 4
How Experimental Design Works — Key Mechanisms
The Role of Random Assignment
Random assignment is not the same as random selection, and confusing these two concepts is one of the most common errors on the AP Statistics exam. Random selection refers to how experimental units are chosen from a population — it allows generalization from a sample to the broader population. Random assignment refers to how units already in the study are allocated to treatment groups — it allows causal conclusions. An experiment can use one, both, or neither; the strongest inference is possible when both are present.
| Feature | Random Selection | Random Assignment |
|---|---|---|
| What it does | Chooses who is in the study from the population | Allocates study participants to treatment groups |
| Purpose | Reduces sampling bias; enables generalization to the population | Balances confounders; enables causal inference |
| Inference supported | Generalization | Causation |
| Example | SRS of 500 adults from the U.S. population | Flip a coin to decide which group each participant joins |
Comparison of random selection vs. random assignment
Blinding and the Placebo Effect
Even with proper randomization, human psychology can introduce bias. The placebo effect occurs when subjects respond to the mere expectation of receiving an effective treatment. To combat this, researchers employ blinding. In a single-blind experiment, the subjects do not know which treatment they are receiving. In a double-blind experiment, neither the subjects nor the researchers who interact with them and measure outcomes know the assignment. Double-blinding prevents both the placebo effect and unconscious bias by evaluators, and it is considered the gold standard for clinical trials. A placebo is a dummy treatment (such as a sugar pill) that is indistinguishable from the real treatment to the subjects.
Scope of Inference
The combination of random selection and random assignment determines the scope of inference — what conclusions a study can support. With both random selection and random assignment, you can make causal claims about the entire population. With only random assignment (but a convenience sample), you can claim causation only for units similar to those in the study. With only random selection (an observational study), you can generalize associations to the population but cannot claim causation. With neither, the study is severely limited in its conclusions.
SECTION 5
Types of Experimental Designs
While the completely randomized design is the most straightforward layout, experimenters often need more sophisticated designs to control for known sources of variability or to study multiple factors simultaneously. The AP Statistics curriculum focuses on three primary designs: the completely randomized design (CRD), the randomized block design (RBD), and the matched-pairs design (a special case of the block design). Understanding when to use each design is as important as understanding how they work.
In a completely randomized design, every unit has an equal chance of receiving any treatment, and there is no preliminary grouping. This works well when the experimental units are relatively homogeneous. In a randomized block design, units are first sorted into blocks based on a variable that is expected to affect the response (such as age, gender, or pre-existing condition), and then units within each block are randomly assigned to treatments. This ensures that each treatment group contains a representative mix of the blocking variable, reducing variability and increasing the experiment's ability to detect true treatment effects.
The matched-pairs design is a special case where each block contains exactly two experimental units that are as similar as possible (e.g., twins), or where the same subject receives both treatments in random order (a crossover design). By comparing differences within pairs rather than between separate groups, matched-pairs designs can be especially powerful at detecting small treatment effects, because much of the subject-to-subject variation is eliminated.
 Measurements taken from the same person remain linked. Compare within-person differences instead of treating the two columns as independent samples.
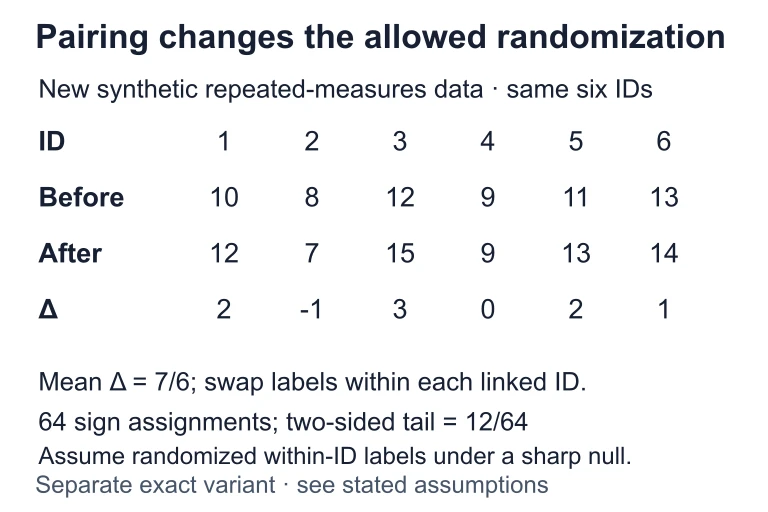 Suppose the same six IDs have differences 2, −1, 3, 0, 2 and 1, averaging 7/6. Under a sharp zero-effect null with randomized or exchangeable within-ID labels, 2⁶ = 64 sign assignments are allowed; 12 have absolute mean at least 7/6. Repeated measurement alone does not establish that exchangeability.
SECTION 6
Worked Example — Designing an Experiment
A biology teacher wants to determine whether a new fertilizer increases the growth rate of tomato plants compared to the standard fertilizer currently used in the school greenhouse. She has 30 tomato seedlings of the same variety, all approximately the same height. She also knows that the greenhouse has two shelves: the top shelf receives more light than the bottom shelf. Design an experiment to test the fertilizer's effectiveness.
Designing a Randomized Block Experiment
- 1
Step 1 — Identify the Components
The experimental units are the 30 tomato seedlings. The explanatory variable (factor) is the type of fertilizer, with two levels: new fertilizer and standard fertilizer. The response variable is the plant growth rate (measured as height increase in centimeters over four weeks).Factor: Fertilizer type (2 levels) • Response: Growth rate (cm/4 weeks) • Units: 30 seedlings - 2
Step 2 — Identify the Blocking Variable
Because the top and bottom shelves differ in light exposure, shelf position is a known source of variability that could confound results. We use shelf position as the blocking variable. Place 15 seedlings on the top shelf (Block 1) and 15 on the bottom shelf (Block 2).Block 1: 15 seedlings (top shelf) • Block 2: 15 seedlings (bottom shelf) - 3
Step 3 — Randomly Assign Within Blocks
Within each block, number the seedlings 1 through 15. Use a random number generator to select 7 or 8 seedlings from each block to receive the new fertilizer; the remaining seedlings receive the standard fertilizer. For example, in Block 1, assign seedlings whose numbers correspond to the first 8 unique random integers between 1 and 15 to the new fertilizer group, and the remaining 7 to the standard fertilizer group. Repeat for Block 2 with 8 receiving new and 7 receiving standard (or vice versa, as long as group sizes are balanced).Each block has approximately equal numbers assigned to new and standard fertilizer by a chance mechanism. - 4
Step 4 — Apply Treatments and Control Extraneous Variables
Apply the assigned fertilizer to each seedling according to the manufacturer's recommended dosage. All other conditions — watering schedule, soil type, pot size, temperature — should be kept the same for all seedlings. These are the controlled variables. Note that this is not double-blind because the teacher knows which plants receive which fertilizer and the plants cannot exhibit a placebo effect; however, she could use single-blind measurement by having a colleague who does not know the assignment measure the plants. - 5
Step 5 — Measure, Compare, and Conclude
After four weeks, measure the height of every seedling and calculate the mean growth for each treatment group within each block, then compare treatments while retaining shelf as a block in the analysis. If the mean growth of the new-fertilizer group is significantly greater than the standard-fertilizer group (using a statistical analysis that accounts for shelf blocks, such as an ANOVA with treatment and shelf terms), and because the experiment used random assignment, the teacher can conclude that the new fertilizer caused the increase in growth. However, because the seedlings were not randomly selected from all possible tomato plants, generalization beyond this particular batch of seedlings should be made cautiously.Random assignment → causal conclusion possible. No random selection → limited generalization.
 The top shelf receives more light than the lower shelf. Place both fertilizer treatments on each shelf, control watering, soil and pot size, and measure height increase over four weeks.
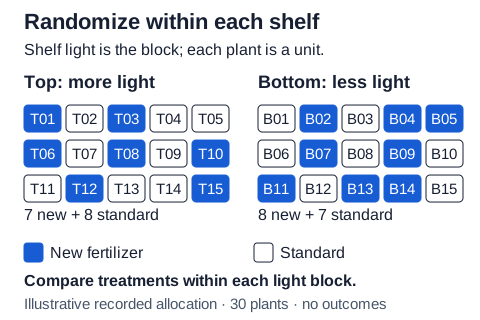 For 30 seedlings, form two 15-plant shelf blocks and randomize both fertilizers within each shelf. The shown allocation assigns 7 new and 8 standard on top, 8 new and 7 standard below. Compare treatment growth within shelves so the light difference stays in the analysis.Open full diagram
SECTION 7
Strengths, Limitations, and Common Pitfalls
Experiments are the most powerful tool for establishing causation, but they are not always feasible or appropriate. Understanding the strengths and limitations of experimental design helps you evaluate research critically and recognize situations where an observational study may be the only ethical or practical option.
| Aspect | Strengths | Limitations |
|---|---|---|
| Causal Inference | Random assignment allows researchers to attribute differences in the response to the treatment, establishing cause-and-effect relationships. | Causation claims are valid only when randomization is properly implemented and maintained. |
| Control of Confounders | Controlled environments and random assignment reduce the influence of confounding variables, both known and unknown. | It is impossible to control every extraneous variable; some experiments require impractical or artificially constrained settings. |
| Ethics | When ethically permissible, experiments provide the strongest evidence for informing medical treatments and public policy. | Many important questions (e.g., effects of smoking, poverty) cannot be ethically studied via experiments because it would require imposing harmful conditions. |
| Generalizability | Internal validity (confidence in the causal conclusion) is typically high when the design is sound. | External validity (ability to generalize to other populations or settings) may be limited if the sample is not representative. |
| Practical Feasibility | Small-scale experiments (e.g., agricultural plots, classroom studies) can be relatively inexpensive and fast. | Large-scale experiments (e.g., multi-year drug trials) can be extremely expensive and time-consuming. |
Strengths and limitations of experimental design
Common AP Exam Pitfall
KEY TAKEAWAY
SECTION 8
Connections to Inference and Advanced Topics
The principles of experimental design you have learned in this lesson lay the groundwork for the inferential statistics you will study later in the AP Statistics course. When you encounter hypothesis testing and confidence intervals, you will see that the validity of these procedures depends entirely on how the data were collected. A statistically significant p-value is meaningless if the experiment was poorly designed, because the observed effect could be due to confounding rather than the treatment. Conversely, a well-designed experiment with proper randomization and replication provides data that can be analyzed with confidence.
| Concept in This Lesson | Connection to Later Topics |
|---|---|
| Random assignment creates comparable groups | Justifies the independence assumption in two-sample t-tests and ANOVA |
| Replication provides multiple observations | Increases statistical power and reduces the standard error of estimates |
| Blocking reduces within-group variability | Connects to paired t-tests, which analyze within-pair differences rather than between-group differences |
| Confounding threatens internal validity | Leads to the study of Simpson's Paradox and multiple regression in advanced courses |
| Scope of inference (causation vs. generalization) | Directly tested in free-response conclusions — students must match their language to the study design |
How experimental design concepts connect to inference
In more advanced statistics and data science courses, you will encounter factorial designs (experiments with multiple factors varied simultaneously), Latin square designs, and response surface methodology. These are extensions of the principles covered here. Modern technology companies use A/B testing — essentially a completely randomized design applied at massive scale — to test everything from website layouts to pricing strategies, demonstrating that Fisher's century-old principles remain central to contemporary data-driven decision-making. As you move forward, remember that no statistical method can rescue a poorly designed study; good inference begins with good design.
SECTION 9
Practice Problems
Question 1: CONCEPTUAL
- A. Because the sample size of 60 is large enough to eliminate all confounding variables.
- B. Because the volunteers chose to participate, ensuring they are motivated and representative of the population.
- C. Because random assignment tends to balance both known and unknown confounding variables across the two groups, so differences in exam scores can be attributed to the study technique.
- D. Because the researcher selected volunteers from a university, which is a random sample of all students.
- E. Because the two-week time period is long enough to eliminate the effects of prior knowledge.
Show answer (C)
Question 2: BASIC CALCULATION
- A. 3 treatments; approximately 67 patients per group
- B. 4 treatments; approximately 50 patients per group
- C. 3 treatments; approximately 50 patients per group, with 50 unassigned
- D. 4 treatments; approximately 40 patients per group, with 40 in reserve
- E. 2 treatments; 100 patients per group (drug vs. placebo)
Show answer (B)
Question 3: INTERMEDIATE
- A. Completely randomized design, because it is the simplest and most widely used approach.
- B. Matched-pairs design, pairing each freshman with a senior and randomly assigning one to each treatment.
- C. Randomized block design, blocking by grade level, then randomly assigning students within each block to one of the two treatments.
- D. Observational study, because it would be unethical to impose anxiety-reducing treatments on students.
- E. Stratified random sample of 40 students from the school, then assign treatments randomly.
Show answer (C)
Question 4: APPLIED
4 ptsShow answer
Question 5: CRITICAL THINKING
4 ptsShow answer
SUMMARY
Summary — Introduction to Experimental Design
Summary
Experimental design is the cornerstone of statistical reasoning about causation. An experiment deliberately imposes a treatment on experimental units and measures a response variable. The four pillars — control, randomization, replication, and blocking — work together to minimize the effects of confounding variables and allow researchers to draw causal conclusions. Random assignment is the key mechanism enabling causation claims, while random selection enables generalization to a broader population.
The three designs you need to know for AP Statistics are the completely randomized design (simplest; units assigned entirely by chance), the randomized block design (group similar units first, then randomize within blocks), and the matched-pairs design (blocks of size two). Additional techniques like blinding and placebos prevent psychological biases from distorting results. On the AP exam, always specify how randomization is performed, what is being compared, and why the design supports (or does not support) a causal conclusion.