

SECTION 1
Historical Context & Motivation
The question of whether an observed pattern is genuine or merely a product of chance is among the oldest intellectual puzzles in quantitative reasoning. Long before modern statistics existed as a formal discipline, gamblers, astronomers, and natural philosophers grappled with the distinction between random variation and systematic patterns. Early astronomers recording the positions of celestial bodies noticed that measurement errors seemed to scatter unpredictably around a central value, while the underlying planetary motion followed deterministic laws. This observation — that data can simultaneously contain predictable structure and unpredictable noise — became the conceptual foundation on which probability theory and statistical inference were eventually built.
1654 • Pascal-Fermat Correspondence
1733 • De Moivre's Normal Approximation
1809 • Gauss and the Method of Least Squares
1900 • Pearson's Chi-Square Test
1925 • Fisher's Statistical Methods
The central question that unites these historical developments remains at the heart of AP Statistics today: given a set of observed data, how do we determine whether the patterns we see reflect a genuine underlying structure, or whether they could plausibly have arisen from random chance alone? Answering this question requires us to first understand what randomness actually looks like, what properties it possesses, and how it differs from the deterministic or systematic patterns we seek to identify.
SECTION 2
Core Principles & Definitions
Before we can assess whether data exhibit randomness or systematic structure, we need precise definitions. In statistics, randomness does not mean chaotic or unpredictable in the colloquial sense — it means that individual outcomes are uncertain, but the long-run distribution of outcomes is governed by a stable, describable probability model. A non-random pattern, by contrast, is a systematic departure from what that probability model would predict, suggesting the presence of an explanatory factor beyond chance. The interplay between these two concepts forms the backbone of statistical reasoning, from exploratory data analysis through formal inference.
Random Process
Random Variation (Noise)
Systematic Pattern (Signal)
Statistical Significance
Probability Distribution
KEY TAKEAWAY
SECTION 3
Visualizing Random vs. Non-Random Patterns
One of the most powerful ways to distinguish random from non-random behavior is to visualize data. The following diagram contrasts two sequences of observations: one generated by a truly random process, and one that contains a systematic trend embedded within random noise. Recognizing these visual signatures is an essential skill for interpreting residual plots, time-series graphs, and sampling distributions throughout the AP Statistics curriculum.
In Panel A, the data exhibit the hallmarks of pure random variation: there is no upward or downward drift, no clustering, and no cyclic behavior. Points fall above and below the mean with roughly equal frequency and no discernible order. In Panel B, by contrast, there is a clear systematic upward trend — even though individual observations still fluctuate around the trend line due to random noise. Recognizing this distinction visually is the first step toward understanding why formal statistical tools like hypothesis tests and confidence intervals exist: they provide a rigorous, quantitative way to decide whether a pattern like the one in Panel B is real, or whether it could plausibly have occurred by chance as in Panel A.
SECTION 4
Mathematical Framework
To formalize the distinction between random and non-random patterns, we need the language of random variables and probability distributions. A random variable is a numerical quantity whose value is determined by a random process; its probability distribution describes the relative likelihood of every possible outcome. The expected value (mean) of a random variable tells us where the center of the distribution lies, while its variance quantifies the spread of random variation around that center. Together, these two parameters establish a baseline model of 'what randomness looks like,' against which we can measure any observed departure.
EXPECTED VALUE (DISCRETE)
Where X is a discrete random variable, xᵢ represents each possible outcome, and P(xᵢ) is the probability of that outcome. The expected value μ is the long-run average of the random process.
VARIANCE
The variance σ² measures the average squared deviation of each outcome from the mean. A larger variance indicates greater random spread. The standard deviation σ = √(σ²) is the square root of variance and is expressed in the same units as X.
OBSERVED DATA MODEL
This is the fundamental decomposition of any observation. In regression, for instance, yᵢ = β₀ + β₁xᵢ + εᵢ, where β₀ + β₁xᵢ is the systematic part (the trend) and εᵢ is the random error term. If there is no systematic component, the observation is purely random noise centered at the mean.
The decomposition Observed = Systematic + Random is the conceptual engine of AP Statistics. When we perform a hypothesis test, our null hypothesis typically asserts that the systematic component is zero — that everything we observe is just random variation. We then ask: if the null hypothesis were true, how likely would it be to observe data as extreme as what we actually collected? If the answer is 'very unlikely,' we conclude that a non-random pattern exists. This framework applies whether we are testing a difference in means, a correlation, a proportion, or any other statistical quantity.
LAW OF LARGE NUMBERS
As the sample size n grows, the sample mean x̄ₙ converges to the true population mean μ. This law guarantees that random variation averages out in the long run, which is why larger samples provide more reliable estimates and make it easier to detect non-random patterns.
SECTION 5
Classifying Patterns in Data
In practice, data patterns fall into several recognizable categories, and a trained statistician must be able to identify each type. Random scatter is the absence of any discernible pattern: points are distributed without trend, without clustering, and without periodicity. Trends are systematic increases or decreases over time or across an ordered variable. Clusters are groups of data points that are more similar to each other than to the rest of the data, suggesting the presence of subpopulations. Cycles are repeating patterns that occur at regular intervals, often reflecting seasonal or periodic phenomena. Each of these pattern types represents a potential non-random structure that demands investigation and explanation.
| Pattern Type | Visual Signature | Statistical Implication | Example in AP Stats |
|---|---|---|---|
| Random Scatter | No trend, no clusters, no periodicity | Consistent with null hypothesis; no evidence of systematic effect | Residual plot after a good regression fit |
| Linear Trend | Consistent upward or downward direction | Suggests a linear relationship between variables; non-zero slope | Scatterplot of study hours vs. exam score |
| Clusters | Distinct groupings separated by gaps | Suggests hidden subpopulations or confounding variables | Bimodal histogram suggesting two groups in data |
| Cyclical | Repeating wave-like oscillation | Suggests periodic process; may violate independence assumption | Seasonal sales data in a time-series plot |
Summary of common data pattern types, their visual signatures, and AP Statistics applications
SECTION 6
Worked Example: Detecting a Non-Random Pattern
A quality control engineer at a bottling plant measures the fill volume (in ounces) of 10 consecutive bottles from the production line. The target fill is 12.00 oz. The measured values are: 12.03, 12.05, 12.07, 12.04, 12.08, 12.10, 12.09, 12.12, 12.11, 12.14. She wants to determine whether these data suggest a random process centered at 12.00 oz, or whether there is a non-random upward trend indicating that the machine is drifting out of calibration.
Analyzing Bottle Fill Data for Non-Random Patterns
- 1
Step 1 — Compute the Sample Mean
We first calculate the sample mean to see where the data are centered. x̄ = (12.03 + 12.05 + 12.07 + 12.04 + 12.08 + 12.10 + 12.09 + 12.12 + 12.11 + 12.14) ÷ 10 = 120.83 ÷ 10.x̄ = 12.083 oz - 2
Step 2 — Examine the Deviations from Target
All ten observations exceed 12.00 oz, with deviations +0.03,+0.05,+0.07,+0.04,+0.08,+0.10,+0.09,+0.12,+0.11,+0.14. If the deviations are independent and P(fill > 12.00) = 1/2, the probability that all ten are positive is (1/2)¹⁰ = 1/1024 ≈ 0.000977. A mean of 12.00 by itself does not imply equal probabilities above and below the target.Under independent fair-sign assumptions: P(all ten above) = 1/1024. - 3
Step 3 — Check for Trend
In order, the readings generally rise from 12.03 to 12.14 oz, with local dips. This describes the observed sample; assessing how surprising its trend is requires a specified chance model. The supplemental comparison is synthetic and is not an additional observed sample.Upward trend detected: first observation = 12.03, last observation = 12.14 (increase of 0.11 oz) - 4
Step 4 — Interpret the Results
All ten readings are above target, the sample mean is 12.083 oz, and the sequence generally rises. These observations warrant investigating the process and checking a justified chance model. Under the independent fair-sign model, ten positive deviations are unlikely, but this sample alone does not identify the cause or establish that immediate recalibration is the appropriate intervention.Observed upward pattern: investigate the process and model assumptions before diagnosing a cause.
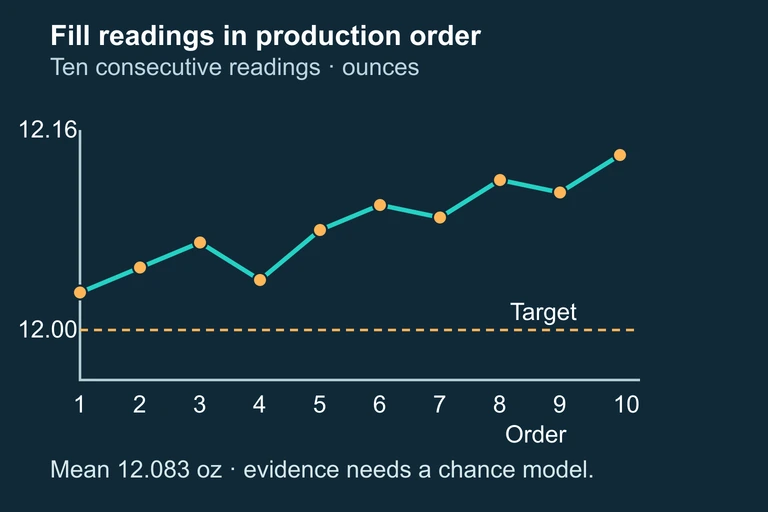 The fill readings remain in production order; apparent trends can arise by chance, and the stated sign probability requires independent fair signs.
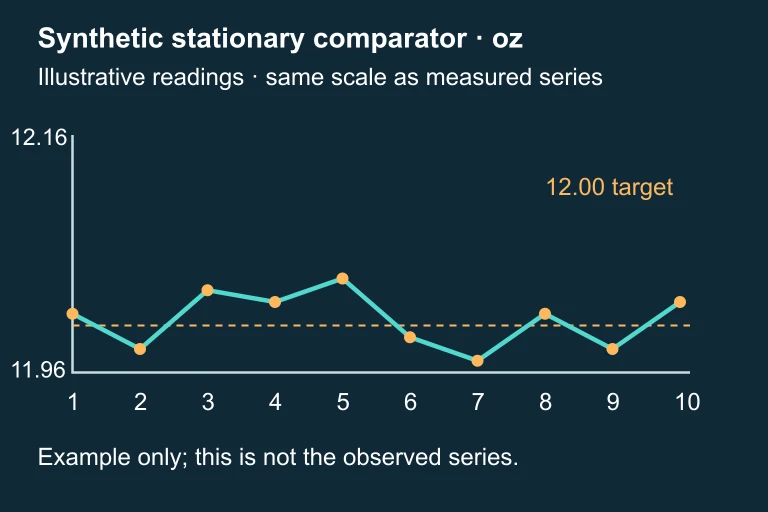 Synthetic comparison fill sequence shown on the same 11.96 to 12.16 oz scale as the observed sequence.
SECTION 7
Strengths & Common Pitfalls
Distinguishing random from non-random patterns is a powerful skill, but it also comes with important caveats. Overconfidence in detecting patterns — or failure to recognize genuine randomness — can lead to flawed conclusions. The table below contrasts the strengths of pattern-recognition thinking with the most common pitfalls students encounter on the AP Statistics exam.
| Strengths | Common Pitfalls |
|---|---|
| Provides a structured framework for deciding whether observed data are consistent with chance | Apophenia: seeing patterns in genuinely random data (e.g., 'hot hand' in sports, streaks in coin flips) |
| Applicable to any type of data — numerical, categorical, time-series, or spatial | Confusing correlation with causation: a non-random association does not prove a causal mechanism |
| Connects naturally to formal tools: hypothesis tests, confidence intervals, and regression | Ignoring sample size: small samples can show dramatic-looking patterns purely by chance; large samples can flag trivially small effects as 'significant' |
| Visual tools (scatterplots, residual plots, histograms) make pattern detection intuitive and accessible | Expecting randomness to 'look random': truly random sequences often contain streaks and clusters that look suspicious but are perfectly normal |
| Encourages critical thinking about data collection methods and potential biases | Multiple testing: looking at many variables increases the chance of finding a spurious 'pattern' just by luck |
Comparing the analytical strengths of random vs. non-random pattern detection with the most common reasoning errors
KEY TAKEAWAY
SECTION 8
Connecting to Probability Distributions & Inference
The concepts of random and non-random patterns introduced in this lesson serve as the foundation for the major probability distributions and inferential procedures you will encounter throughout AP Statistics. Understanding how randomness behaves — and what constitutes a departure from it — is precisely what enables you to construct and interpret confidence intervals, perform hypothesis tests, and evaluate regression models. The table below maps the core ideas from this lesson to their more advanced counterparts.
| Concept from This Lesson | Advanced Application in AP Statistics |
|---|---|
| Random variation around a mean | Normal distribution: models how random measurements cluster around μ with spread σ; basis for z-tests and t-tests |
| Probability of observing outcomes by chance | Binomial and geometric distributions: count successes or trials in a random process with fixed probability p |
| Decomposition: Observed = Systematic + Random | Linear regression: yᵢ = β₀ + β₁xᵢ + εᵢ; residuals εᵢ should show random scatter if model is correct |
| Identifying non-random trends in data | Hypothesis testing: H₀ asserts 'randomness only'; if data are extreme under H₀, we reject in favor of Hₐ |
| Law of Large Numbers (sample mean → μ) | Sampling distributions and the Central Limit Theorem: the distribution of x̄ becomes approximately normal as n increases |
Mapping introductory concepts to their advanced counterparts in the AP Statistics curriculum
As you progress through the course, every new topic will fundamentally rely on the question posed in this lesson: Is the pattern I observe random or non-random? When you construct a confidence interval, you are quantifying the range of values consistent with random variation around an estimated parameter. When you perform a chi-square test, you are measuring how far observed category counts deviate from what randomness predicts. When you examine a residual plot, you are checking whether the leftovers from your model look like random noise. Mastering the intuition for random versus non-random patterns now will pay dividends in every subsequent unit of the course.
SECTION 9
Practice Problems
Question 1: CONCEPTUAL
- A. A fair coin should always produce exactly 50 heads in 100 flips.
- B. Random variation means that outcomes from a fair coin will naturally fluctuate around the expected value, so 58 heads out of 100 is within the range of plausible outcomes for a fair coin.
- C. She should have flipped the coin exactly 1,000 times before drawing any conclusions.
- D. The Law of Large Numbers guarantees that the proportion of heads will equal exactly 0.50 in any sufficiently large sample.
- E. 58 heads is statistically impossible for a fair coin.
Show answer (B)
Question 2: BASIC CALCULATION
- A. E(X) = 2.5, Var(X) = 1.05
- B. E(X) = 2.5, Var(X) = 1.00
- C. E(X) = 2.5, Var(X) = 1.25
- D. E(X) = 2.5, Var(X) = 1.10
- E. E(X) = 2.0, Var(X) = 1.10
Show answer (A)
Question 3: INTERMEDIATE
- A. The linear model is appropriate because all residuals are close to zero.
- B. The residuals exhibit a non-random pattern, indicating that the linear model does not adequately capture the relationship; a nonlinear model may be more appropriate.
- C. The U-shaped pattern confirms that ice cream sales cause higher temperatures.
- D. The curved residual pattern is a consequence of random variation and should be ignored.
- E. The regression line should be recalculated after removing the outliers that create the U-shape.
Show answer (B)
Question 4: APPLIED
4 ptsShow answer
Question 5: CRITICAL THINKING
4 ptsShow answer
SUMMARY
Lesson Summary
Summary
This lesson introduced the fundamental distinction at the heart of AP Statistics: the difference between random variation (the natural, expected fluctuations produced by chance processes) and non-random patterns (systematic structures in data that suggest a cause beyond chance). We formalized this through the decomposition Observed = Systematic + Random, and we introduced the expected value and variance as the two parameters that characterize a probability distribution — the mathematical model of what randomness looks like.
We identified four key pattern types — random scatter, trends, clusters, and cycles — and learned that only random scatter is consistent with pure chance. We explored common pitfalls, including apophenia (seeing patterns in noise) and the multiple testing problem, and connected this lesson's concepts to the full arc of AP Statistics: normal distributions, hypothesis testing, regression, and the Central Limit Theorem. The ability to distinguish signal from noise is the single most important skill you will develop in this course.