

SECTION 1
Historical Context & Motivation
Statistics has always been driven by a fundamental question: Could this result have happened by chance alone? In the late nineteenth and early twentieth centuries, scientists working with categorical data—counts of organisms, disease outcomes, genetic phenotypes—needed a formal method to decide whether observed frequencies deviated meaningfully from theoretical expectations. The development of the chi-square (χ²) test gave researchers exactly that tool, transforming intuitive suspicion into rigorous inference.
1857 • Gregor Mendel's Pea Experiments
1900 • Karl Pearson Proposes χ²
1922 • Ronald Fisher Refines Degrees of Freedom
1952 • Widespread Adoption in Social Sciences
The central gap these pioneers addressed is one you will encounter constantly on the AP Statistics exam and in research: when your observed data differ from the counts you expected under some hypothesis, how do you determine whether the discrepancy is just sampling variability or evidence that the hypothesis is wrong? The chi-square statistic provides a single number that quantifies the total discrepancy, and the chi-square distribution tells you how likely that discrepancy is if the hypothesis were true.
SECTION 2
Core Principles & Definitions
Before computing anything, you need to understand the foundational concepts that underpin all chi-square inference. These ideas connect the raw counts you collect to the probabilistic reasoning that drives your conclusion. Whether you are testing whether a die is fair, whether two categorical variables are associated, or whether several populations share the same distribution of responses, the same core logic applies.
Observed Counts (O)
Expected Counts (E)
Chi-Square Statistic (χ²)
Degrees of Freedom (df)
P-Value
KEY TAKEAWAY
SECTION 3
Visualizing Observed vs. Expected
The best way to build intuition about chi-square inference is to see the gap between what you expected and what you observed. The diagram below illustrates a simple scenario: you roll a six-sided die 120 times and record the frequency for each face. Under the null hypothesis that the die is fair, you expect each face to appear 20 times. The cyan bars represent observed counts, the dashed line marks the expected count, and the shaded regions highlight the deviations that the chi-square statistic will quantify.
Notice that looking at individual deviations alone does not give you the complete picture. Face 3 matches the expectation perfectly, while faces 4 and 6 diverge substantially in opposite directions. The chi-square statistic will combine all of these deviations into a single summary measure that accounts for both the size of each deviation and the expected count against which it is measured. This aggregation is what allows you to make a single inferential decision rather than evaluating six separate deviations one by one.
SECTION 4
Mathematical Framework
The mathematical backbone of chi-square inference is elegantly simple: you measure how far each observed count is from its expected value, square the difference to eliminate signs, divide by the expected count to standardize, and sum across all categories. The resulting statistic follows, approximately, a chi-square distribution whose shape depends on the degrees of freedom.
CHI-SQUARE TEST STATISTIC
where O = observed count in a category, E = expected count in that same category, and the sum is taken over all k categories.
Each term in the sum, (O − E)² / E, is the contribution from one cell or category. Squaring the numerator ensures that positive and negative deviations both increase χ². Dividing by E standardizes the contribution: a deviation of 5 when the expected count is 10 is proportionally much more surprising than the same deviation of 5 when the expected count is 500. This standardization is critical because it places every category on a comparable scale.
DEGREES OF FREEDOM — GOODNESS-OF-FIT
where k = the number of categories. One degree of freedom is lost because the category counts must sum to the fixed total n.
EXPECTED COUNT — GOODNESS-OF-FIT
where n = total sample size and p₀ = the hypothesized proportion for that category. For a test of independence in a two-way table, E = (row total × column total) / n.
Conditions for Inference
SECTION 5
The Chi-Square Distribution & P-Values
Once you compute the χ² statistic, you need a reference distribution to determine how extreme that value is. The chi-square distribution is a family of right-skewed distributions parameterized by degrees of freedom. As df increases, the distribution becomes more symmetric and shifts to the right. The p-value is always calculated as the area in the right tail because larger χ² values represent greater discrepancies from the null hypothesis. Unlike a t-test, there is no two-sided or left-tail version: chi-square tests are inherently one-directional in the sense that only large values of χ² provide evidence against H₀.
On the AP exam, you will typically use your calculator's χ²cdf function or a chi-square table to find the p-value. On the TI-83/84, the command is χ²cdf(χ²stat, 1E99, df), which returns the probability in the right tail from your test statistic to positive infinity. The key interpretive point is straightforward: if the p-value is less than your significance level α, you reject H₀ and conclude that the observed distribution of counts is significantly different from what the null hypothesis predicted.
SECTION 6
Worked Example: Is This Die Fair?
Let us return to the die-rolling scenario from Section 3. You suspect a six-sided die may be loaded, so you roll it 120 times and record the following frequencies: Face 1 → 25, Face 2 → 15, Face 3 → 20, Face 4 → 30, Face 5 → 18, Face 6 → 12. Perform a chi-square goodness-of-fit test at the α = 0.05 significance level.
Chi-Square Goodness-of-Fit: Fair Die
- 1
Step 1 — State Hypotheses
H₀: The die is fair; each face has probability p = 1/6. Hₐ: The die is not fair; at least one face has a probability different from 1/6. - 2
Step 2 — Check Conditions
Assume the 120 rolls are independent (reasonable for a physical die). Each expected count is E = 120 × (1/6) = 20, which satisfies the requirement that all expected counts be at least 5. The conditions for a chi-square goodness-of-fit test are met.All expected counts = 20 ≥ 5 ✓ - 3
Step 3 — Compute the Chi-Square Statistic
χ² = (25 − 20)²/20 + (15 − 20)²/20 + (20 − 20)²/20 + (30 − 20)²/20 + (18 − 20)²/20 + (12 − 20)²/20 = 25/20 + 25/20 + 0/20 + 100/20 + 4/20 + 64/20 = 1.25 + 1.25 + 0 + 5.00 + 0.20 + 3.20 = 10.90χ² = 10.90 - 4
Step 4 — Determine Degrees of Freedom & P-Value
df = k − 1 = 6 − 1 = 5. Using a calculator: χ²cdf(10.90, 1E99, 5) ≈ 0.0534. Alternatively, consulting a chi-square table, the critical value for df = 5 at α = 0.05 is 11.07.p-value ≈ 0.0534, df = 5 - 5
Step 5 — State the Conclusion in Context
Since the p-value (≈ 0.0534) is greater than α = 0.05, we fail to reject H₀. There is not sufficient evidence at the 5% significance level to conclude that the die is unfair. While the deviations are noticeable—particularly for faces 4 and 6—they are not statistically significant by this standard. Note, however, that the result is borderline; a researcher using α = 0.10 would reject H₀.Fail to reject H₀ at α = 0.05. Insufficient evidence that the die is unfair.
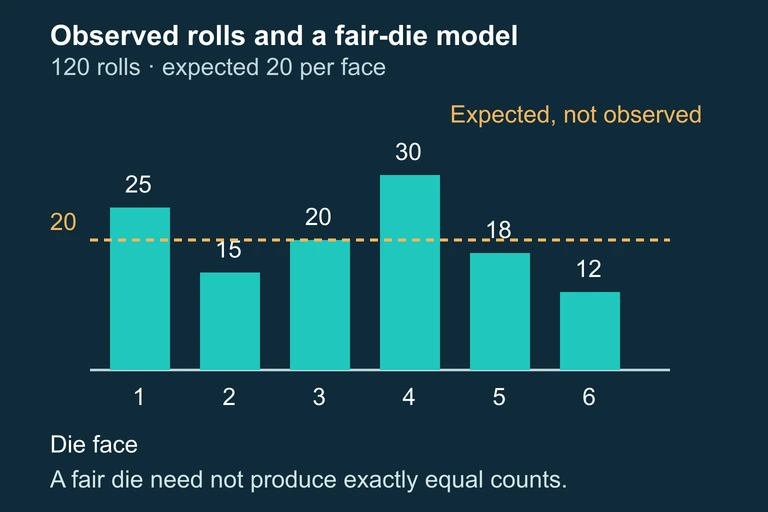 Observed face counts total 120, while the fair-die model expects 20 per face; one fair run need not match those expectations exactly.
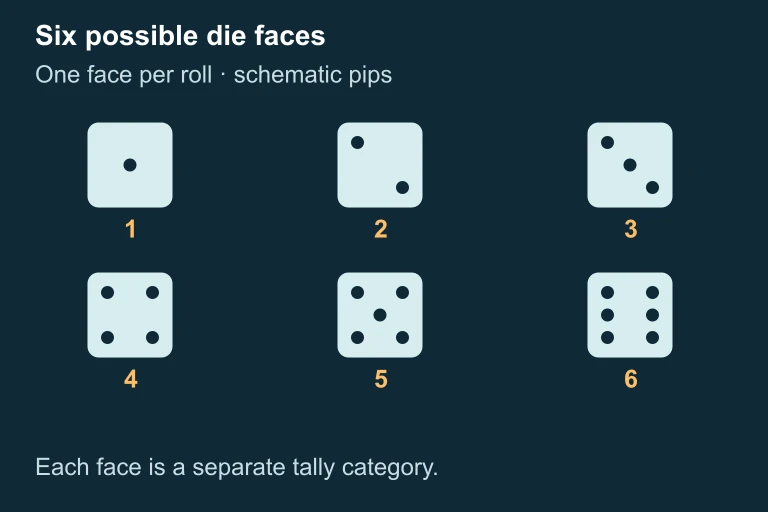 Six labeled die-face icons with exactly one through six pips.
SECTION 7
Strengths, Limitations & Common Pitfalls
The chi-square test is remarkably versatile and appears throughout the AP Statistics curriculum in three forms—goodness-of-fit, test of independence, and test of homogeneity—but it is not without limitations. Understanding where the test shines and where it breaks down will help you choose the right inferential tool and avoid common exam mistakes.
| Strengths | Limitations | Common Pitfalls on the AP Exam |
|---|---|---|
| Works with categorical (nominal or ordinal) data—no normality assumption on the variable itself. | Requires all expected counts ≥ 5; small expected counts make the chi-square approximation unreliable. | Using observed counts where expected counts belong in the denominator of the χ² formula. |
| Easy to compute by hand and by calculator; the formula is the same for all three chi-square tests. | Cannot indicate the direction or nature of the association—only that a discrepancy exists. | Forgetting to state hypotheses in context (e.g., writing generic H₀ instead of referencing the specific variables). |
| Applicable to a wide range of research designs: surveys, experiments, observational studies. | Sensitive to sample size: with very large n, even trivially small deviations become 'significant.' | Confusing the test of independence (one sample, two variables) with the test of homogeneity (multiple populations, one variable). |
| Only requires counts; no need to assume equal variances or specific distributional shapes. | Not appropriate for paired or matched data; observations must be independent. | Failing to check the expected count condition or the random sampling / independence condition. |
Summary of strengths, limitations, and common AP exam pitfalls for chi-square tests
KEY TAKEAWAY
SECTION 8
Connecting to Advanced Chi-Square Tests
The goodness-of-fit test you have just learned is the simplest member of the chi-square family. The AP Statistics exam also requires mastery of two closely related tests that use the same χ² = Σ(O − E)² / E formula but apply it to two-way tables. Understanding the relationships among these three tests—and how they differ in design and hypotheses—is essential for exam success.
| Feature | Goodness-of-Fit | Test of Independence | Test of Homogeneity |
|---|---|---|---|
| Number of variables | One categorical variable | Two categorical variables | One categorical variable across multiple populations |
| Number of samples | One sample | One sample | Two or more independent samples |
| Null hypothesis | The variable follows a specified distribution | The two variables are independent (no association) | The distribution of the variable is the same across all populations |
| Degrees of freedom | k − 1 | (r − 1)(c − 1) | (r − 1)(c − 1) |
| How E is computed | E = n × p₀ from hypothesized proportions | E = (row total × column total) / n | E = (row total × column total) / n |
Comparison of the three chi-square tests on the AP Statistics exam
As you progress through the chi-square unit, you will see that the test of independence and the test of homogeneity are computationally identical—the same formula, the same degrees of freedom, the same expected-count calculation. The distinction is entirely about study design and interpretation. The test of independence asks whether two variables are associated within a single population, while the test of homogeneity asks whether the distribution of a single variable is the same across several populations or treatments. This distinction frequently appears in free-response questions, so practice identifying the study design before you begin computing.
SECTION 9
Practice Problems
Question 1: CONCEPTUAL
- A. To make the computation easier to perform by hand.
- B. To prevent positive and negative deviations from canceling each other out.
- C. To convert the test statistic into a z-score.
- D. To ensure the chi-square statistic is always less than 1.
- E. To adjust for the fact that expected counts are estimated.
Show answer (B)
Question 2: BASIC CALCULATION
- A. 10
- B. 26
- C. 30
- D. 35
- E. 90
Show answer (C)
Question 3: INTERMEDIATE
- A. 3.0
- B. 4.6
- C. 5.0
- D. 7.8
- E. 10.0
Show answer (C)
Question 4: APPLIED
4 ptsShow answer
Question 5: CRITICAL THINKING
4 ptsShow answer
SUMMARY
Summary & Key Concepts
Summary
The central question in this lesson—Are my results unexpected?—is answered by computing the chi-square statistic χ² = Σ(O − E)² / E, which measures the total standardized discrepancy between observed counts and expected counts under a null hypothesis. Large values of χ² signal that the data are unlikely to have arisen from the hypothesized model, and the p-value—the right-tail area under the chi-square distribution with the appropriate degrees of freedom—quantifies how surprising the observed discrepancy is.
Before computing, always verify three conditions: the data come from a random sample or random assignment, observations are independent, and all expected counts are at least 5. The goodness-of-fit test introduced here uses df = k − 1 and compares one sample's distribution to a hypothesized model. This same logic extends to the test of independence and the test of homogeneity in two-way tables, where expected counts are calculated as (row total × column total) / n and degrees of freedom are (r − 1)(c − 1). Mastering this foundational framework prepares you for all chi-square inference on the AP exam.