

SECTION 1
Historical Context & Motivation
Statistics was born from a practical dilemma: how can we draw reliable conclusions about a large group when we can only observe a small part of it? Long before modern polling and clinical trials, scholars recognized that individual observations are inherently noisy, and that patterns become clear only when data are aggregated thoughtfully. The concept of sampling variability — the idea that different samples drawn from the same population will yield different results — is the engine that drives all of statistical inference. Understanding why your sample is not like mine is the first step toward quantifying uncertainty and making evidence-based decisions.
1713 • Bernoulli's Ars Conjectandi
1809 • Gauss and the Normal Curve
1908 • Student's t-Distribution
1933 • Neyman's Confidence Intervals
1948 • Modern Survey Sampling
The central question that links all of these developments is deceptively simple: if I draw one random sample and you draw another, why should we expect different results, and how different should we expect them to be? Answering this question requires a precise understanding of sampling distributions — the theoretical distributions that describe how a statistic behaves across all possible samples of a given size.
SECTION 2
Core Principles & Definitions
Before examining the mathematics, it is essential to anchor the vocabulary that AP Statistics expects you to command. The distinction between a parameter and a statistic underpins everything: a parameter is a fixed numerical characteristic of a population (such as the true mean μ or the true proportion p), whereas a statistic is the corresponding value calculated from a sample (such as x̄ or p̂). Because the sample is random, every statistic is a random variable, and its distribution across all possible samples of size n is the sampling distribution.
Population vs. Sample
Parameter vs. Statistic
Sampling Variability
Sampling Distribution
Bias and Variability
SECTION 3
Visualizing Sampling Variability
The diagram below illustrates the core idea: a single population gives rise to many possible samples, each of which produces its own sample mean. Collecting these sample means into a histogram reveals the sampling distribution of x̄. Notice that while each individual sample mean differs, their collective distribution has a predictable center and spread.
Several features of this diagram deserve attention. First, the center of the sampling distribution coincides with the population mean μ — this is the defining property of an unbiased estimator. Second, the spread of the sampling distribution is considerably smaller than the population's own spread. While individual observations range widely (σ = 10), the sample means cluster within about ±4 of the population mean (standard error = 2). This shrinkage reflects the averaging effect: extreme values in a sample tend to cancel out. Third, the shape of the sampling distribution is approximately normal even though no assumption was stated about the population shape — a preview of the Central Limit Theorem that you will study in depth shortly.
 A tray contains individual observations, but its average contributes one value to a distribution of sample means. Repeating the sampling process reveals how that statistic varies.
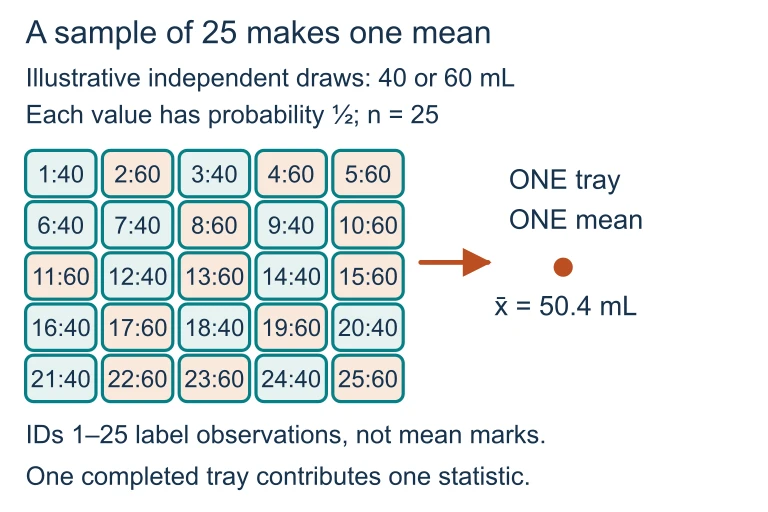 Suppose each independent fill is equally likely to be 40 or 60 mL. This tray contains twelve 40-mL and thirteen 60-mL fills, totaling 1,260 mL; its 25 observations contribute one mean, 50.4 mL.
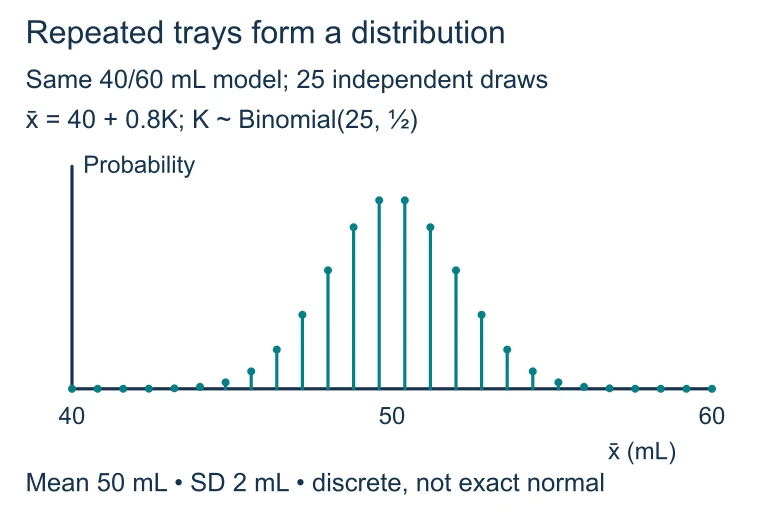 For 25 independent fills equally likely to be 40 or 60 mL, K is binomial with n = 25 and p = 0.5, and the tray mean is 40 + 0.8K. The exact distribution is discrete, centered at 50 mL with standard deviation 2 mL. A normal curve approximates its shape.
SECTION 4
Mathematical Framework
The behavior of sampling distributions is governed by a small set of elegant results. These formulas quantify the center, spread, and shape of the distribution of common statistics, transforming an intuitive idea into a precise tool for inference.
MEAN OF THE SAMPLING DISTRIBUTION OF x̄
The mean of the sampling distribution of x̄ equals the population mean μ. This confirms that x̄ is an unbiased estimator of μ — on average, the sample mean hits the target.
STANDARD ERROR OF x̄
The standard error measures how much x̄ varies from sample to sample. It decreases with the square root of the sample size n, meaning that quadrupling n cuts the standard error in half.
MEAN OF THE SAMPLING DISTRIBUTION OF p̂
For a sample proportion p̂, the center of its sampling distribution equals the true population proportion p. Like x̄, p̂ is unbiased.
STANDARD ERROR OF p̂
The variability of p̂ depends on both the true proportion p and the sample size n. The spread is maximized when p = 0.5 and decreases as p moves toward 0 or 1, reflecting the reduced uncertainty when events are rare or near-certain.
SECTION 5
The Effect of Sample Size on Variability
One of the most important insights in statistics is that increasing the sample size reduces sampling variability. The relationship is not linear — the standard error decreases proportionally to 1/√n, producing diminishing returns. Moving from n = 25 to n = 100 halves the standard error, but moving from n = 100 to n = 400 is required to halve it again. The diagram below compares three sampling distributions for x̄ with the same population but different sample sizes, illustrating this tightening effect.
| Sample Size (n) | Standard Error σ_{x̄} | Relative Width |
|---|---|---|
| 10 | 30/√10 ≈ 9.49 | Widest — high variability |
| 25 | 30/√25 = 6.00 | Moderate |
| 100 | 30/√100 = 3.00 | Narrow — low variability |
| 400 | 30/√400 = 1.50 | Narrowest — very low variability |
Standard error for σ = 30 across several sample sizes
Key takeaway
SECTION 6
Worked Example: Describing a Sampling Distribution
Suppose a large university reports that the mean time students spend studying per week is μ = 14 hours with a standard deviation of σ = 6 hours. A researcher takes a simple random sample of n = 36 students. Describe the sampling distribution of the sample mean x̄ and find the probability that x̄ exceeds 16 hours.
Worked example
- 1
Step 1 — Identify the Parameter and Given Values
The population mean is μ = 14 hours and the population standard deviation is σ = 6 hours. The sample size is n = 36. We are asked about the sampling distribution of x̄. - 2
Step 2 — Check Conditions
The university is described as "large," so the total student population N is well above 360. Since n = 36 ≤ 0.10N, the 10% condition is satisfied, and we may treat observations as approximately independent. Additionally, since n = 36 ≥ 30, the Central Limit Theorem ensures the sampling distribution of x̄ is approximately normal regardless of the population shape. - 3
Step 3 — Compute the Mean of the Sampling Distribution
By the unbiasedness property, μ_{x̄} = μ = 14 hours.μ_{x̄} = 14 hours - 4
Step 4 — Compute the Standard Error
The standard error is σ_{x̄} = σ / √n = 6 / √36 = 6 / 6 = 1 hour.σ_{x̄} = 1 hour - 5
Step 5 — State the Sampling Distribution
The sampling distribution of x̄ is approximately Normal with mean 14 and standard deviation 1. In notation: x̄ ~ N(14, 1). - 6
Step 6 — Compute the Probability P(x̄ > 16)
Convert to a z-score: z = (16 − 14) / 1 = 2. Using the standard normal table or calculator, P(Z > 2) = 1 − 0.9772 = 0.0228.P(x̄ > 16) ≈ 0.0228 (about 2.3%) - 7
Step 7 — Interpret in Context
If the true mean study time is 14 hours, there is only about a 2.3% chance that a random sample of 36 students would produce a sample mean above 16 hours. This low probability would lead us to question whether μ = 14 is correct if we did observe x̄ > 16 — this reasoning is the foundation of hypothesis testing.
SECTION 7
Bias vs. Variability: What Can Go Wrong?
A good estimator must satisfy two criteria: it should be centered on the parameter (low bias) and it should not scatter too widely (low variability). Sampling variability is an inherent consequence of working with samples and can be reduced by increasing n. Bias, on the other hand, is a systematic tendency for the estimator to miss the parameter in one direction, and it cannot be fixed by increasing sample size alone — it requires changing the sampling method. A voluntary response survey, for example, is biased because the respondents are self-selected; no amount of additional voluntary responses will fix the distortion.
| Characteristic | Bias | Variability |
|---|---|---|
| Definition | The sampling distribution is centered away from the true parameter. | The statistic scatters widely across different samples. |
| Source | Flawed sampling design (convenience, voluntary response, undercoverage). | Random chance inherent in drawing a sample. |
| Fixed by larger n? | No — bias persists regardless of sample size. | Yes — standard error decreases as n grows. |
| Remedy | Use probability-based sampling: SRS, stratified, cluster designs. | Increase the sample size n. |
| Dartboard analogy | Darts consistently land to the left of the bullseye. | Darts scatter widely around the bullseye. |
Bias vs. Variability comparison
Key takeaway
SECTION 8
Connection to the Central Limit Theorem and Inference
The ideas in this lesson — that statistics vary from sample to sample, that their variability is quantifiable, and that sampling distributions have predictable shapes — are not ends in themselves. They are the scaffolding upon which all of statistical inference is built. The Central Limit Theorem (CLT) formalizes what we have hinted at: for sufficiently large n, the sampling distribution of x̄ is approximately normal regardless of the population's shape. This normality is what makes z-scores and t-scores viable tools for constructing confidence intervals and performing hypothesis tests.
| Concept | This Lesson (Introduction) | Next Steps (CLT & Inference) |
|---|---|---|
| Focus | Why do different samples give different results? | What exact shape does the sampling distribution take, and how do we use it? |
| Key formula | σ_{x̄} = σ / √n | z = (x̄ − μ) / (σ / √n) and the t-statistic when σ is unknown |
| Shape assumption | Approximately normal for large n (informal) | CLT provides the formal justification and conditions |
| Application | Describing variability and checking conditions | Confidence intervals and hypothesis tests |
This lesson vs. where the course is headed
Keep in mind that sampling distributions also apply to other statistics: the sample proportion p̂, the difference of two means (x̄₁ − x̄₂), and the difference of two proportions (p̂₁ − p̂₂). In every case, the same logic applies: identify the center, compute the spread using the appropriate standard error formula, verify the conditions for normality, and then use the resulting model to make probability statements. Mastering this reasoning now will make every subsequent inference topic feel like a natural extension of the same framework.
SECTION 9
Practice Problems
Question 1: CONCEPTUAL
- A. The polling organization made a measurement error in at least one of the surveys.
- B. The population proportion changed between the two surveys.
- C. Random selection means each sample includes different individuals, producing natural sampling variability.
- D. A sample of 500 is too small to produce consistent results.
- E. The sampling method was biased, causing the proportions to shift.
Show answer (C)
Question 2: BASIC CALCULATION
- A. 0.3125
- B. 1.25
- C. 2.50
- D. 5.00
- E. 20.00
Show answer (C)
Question 3: INTERMEDIATE
- A. Approximately Normal with mean 0.35 and standard deviation 0.0337
- B. Approximately Normal with mean 0.35 and standard deviation 0.2275
- C. Approximately Normal with mean 70 and standard deviation 6.75
- D. Approximately Normal with mean 0.35 and standard deviation 0.0011
- E. The Normal approximation cannot be used because the 10% condition is not satisfied.
Show answer (A)
Question 4: APPLIED
4 ptsShow answer
Question 5: CRITICAL THINKING
4 pts