

SECTION 1
Historical Context & Motivation
For centuries, scientists and physicians relied on anecdotal evidence and uncontrolled observations to evaluate treatments, policies, and interventions. The results were often misleading: a new tonic might appear effective simply because patients who chose to take it were healthier to begin with. The fundamental problem—confounding variables—made it impossible to separate the effect of the treatment from pre-existing differences between groups. The development of formal experimental design over the twentieth century provided a rigorous framework for making causal inferences rather than merely detecting associations.
1747 • Lind's Scurvy Trial
1925 • Fisher's Principles of Experimental Design
1948 • First Randomized Clinical Trial
1965 • Causal Inference Formalized
The central question this lesson addresses is: Under what conditions can we move beyond association and legitimately claim that one variable causes a change in another? The answer lies in understanding how experiments are designed, why random assignment is essential, and what scope of inference a given study design supports.
SECTION 2
Core Principles of Experiments and Inference
A well-designed experiment is the only data-collection method that supports a cause-and-effect conclusion. Observational studies, no matter how large, can only establish associations because uncontrolled lurking variables may explain observed differences. The following principles distinguish experiments from other study designs and dictate the kind of inference each supports.
Random Assignment
Control Group
Replication
Blinding
KEY TAKEAWAY
SECTION 3
Visual Explanation — Experiment vs. Observational Study
The diagram above captures the essential logic of inference in statistics. When the researcher actively imposes treatments through random assignment, any systematic difference between group outcomes can be attributed to the treatment because randomization balances all other variables—both measured and unmeasured—across groups. In contrast, when subjects choose their own groups (or are sorted by nature, economics, or personal preference), a lurking variable may drive both group membership and the response, producing a spurious association. This distinction is the single most important idea in the AP Statistics curriculum on data collection.
SECTION 4
How Random Assignment Supports Causal Inference
The statistical engine behind experimental inference relies on the concept of sampling variability under the null hypothesis. After random assignment and data collection, statisticians ask: "If the treatment had no effect, how likely is a difference at least as extreme as the one observed?" When that probability (the p-value) is sufficiently small, we reject the null hypothesis and conclude that the treatment caused the observed effect.
Logic of a Randomization Test
Consider an experiment with two groups. After measuring the response variable, compute the observed difference in means (or proportions). Under the null hypothesis that treatment has no effect, every subject would have produced the same response regardless of group assignment. We can simulate thousands of re-randomizations to build a distribution of differences that would occur by chance alone.
OBSERVED STATISTIC
where x̄_treatment and x̄_control are the sample means of the treatment and control groups, respectively.
P-VALUE (TWO-SIDED)
The proportion of all possible random reassignments producing a difference at least as extreme as d_obs. A small p-value (typically < 0.05) provides evidence against the null hypothesis.
Why Randomization Matters Statistically
 Random assignment determines which rearrangements belong in an experimental comparison. Independent groups and measurements linked to the same people require different treatment of the data.
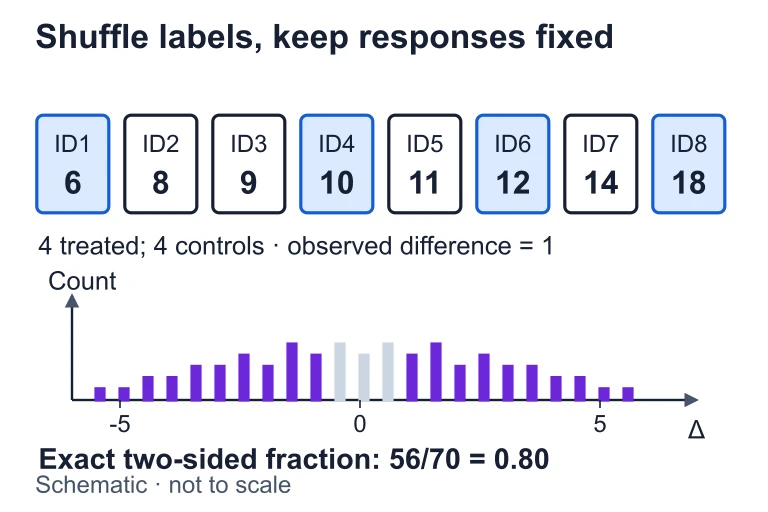 Suppose eight responses are 6, 8, 9, 10, 11, 12, 14 and 18. Under a sharp no-effect null, all 70 assignments of four treatment labels preserve those responses. The observed difference is 1; 56 assignments have an absolute difference at least 1, giving 56/70 = 0.8.
SECTION 5
Scope of Inference — The Two-by-Two Framework
Every statistical study supports a certain scope of inference determined by two design features: whether the study used random selection (to obtain the sample from a larger population) and whether it used random assignment (to allocate subjects to treatments). These two forms of randomness serve different purposes: random selection supports generalizing results to the population, while random assignment supports causal conclusions.
On the AP exam, the most common scenario involves a study that uses random assignment but not random selection—placing it in the upper-right cell. In this case, you can conclude that the treatment caused the observed difference, but only for the subjects in the study, not for any broader population. Conversely, a well-designed survey (random selection, no random assignment) supports generalization but not causation. The ideal—both forms of randomness—is rare outside large-scale clinical trials.
SECTION 6
Worked Example — Identifying Scope of Inference
A researcher wants to study whether background music improves test performance. She recruits 60 volunteers from her university and randomly assigns 30 to take a math test with classical music playing and 30 to take the same test in silence. The music group scores an average of 4.2 points higher. A significance test yields p = 0.014.
What conclusion can the researcher draw?
- 1
Step 1 — Identify random assignment
The researcher randomly assigned subjects to the two conditions (music vs. silence). This is a true experiment, so a causal conclusion about the effect of music is possible if results are statistically significant. - 2
Step 2 — Identify random selection
The subjects are volunteers from one university—not a random sample from any defined population. This means results cannot be generalized beyond the 60 participants. - 3
Step 3 — Evaluate significance
The p-value of 0.014 is less than the conventional α = 0.05. This means the observed difference of 4.2 points is unlikely to have occurred by chance alone if the music truly had no effect.p = 0.014 < 0.05 → statistically significant - 4
Step 4 — State the conclusion in context
Because the study used random assignment and the result is significant, we can conclude that listening to classical music caused the higher test scores for these 60 subjects. However, because the sample was not randomly selected, we cannot generalize this conclusion to all university students or the broader population.Scope: Causal conclusion for subjects in the study only (upper-right cell).
SECTION 7
Experiments vs. Observational Studies — Strengths & Limitations
| Feature | Experiment | Observational Study |
|---|---|---|
| Treatment assignment | Researcher imposes via random assignment | Subjects self-select or are observed as-is |
| Confounding control | Randomization balances known and unknown confounders | Can only control for measured confounders (statistically) |
| Causal inference | Yes — supported | No — only association |
| Ethical feasibility | May be unethical (e.g., assigning smoking) | Can study exposures that cannot be imposed |
| Generalizability | Often limited (convenience samples) | Often broader (large random samples available) |
| Cost & complexity | Typically expensive and time-consuming | Often cheaper; can use existing data |
Comparison of experiments and observational studies across key features
KEY TAKEAWAY
SECTION 8
Connection to Inference Procedures in AP Statistics
The concepts in this lesson lay the groundwork for every inference procedure you will encounter later in the course. When you perform a two-sample t-test, a chi-square test, or a confidence interval, the validity of your conclusion depends on how the data were collected. A statistically significant result from a randomized experiment warrants a causal interpretation; the same p-value from an observational study does not.
| Concept in This Lesson | Where It Reappears Later |
|---|---|
| Random assignment → causal claim | Conclusion step of every significance test ("there is evidence that X causes Y" vs. "there is an association") |
| Random selection → generalizability | Identifying the population to which confidence intervals or test results apply |
| Confounding variables | Explaining why an observed association may not reflect a causal relationship in regression (lurking variables) |
| P-value under H₀ | All hypothesis tests—z-tests, t-tests, chi-square tests—use the same null-hypothesis logic introduced here |
How experiment design concepts recur throughout the AP Statistics curriculum
In more advanced coursework, you would encounter the Rubin Causal Model and techniques like propensity-score matching that attempt to approximate the benefits of randomization in observational data. At the AP level, however, the essential takeaway is simpler: design determines conclusion. Master the scope-of-inference framework, and you will navigate the conclusion step of any FRQ with confidence.
SECTION 9
Practice Problems
Question 1: CONCEPTUAL
- A. The drug causes lower blood pressure in all adults.
- B. The drug is associated with lower blood pressure, but causation cannot be established.
- C. The drug causes lower blood pressure for the subjects in this study, but the result cannot be generalized to a broader population.
- D. Lower blood pressure causes patients to seek out the new drug.
- E. The placebo effect is responsible for the reduction in blood pressure.
Show answer (C)
Question 2: BASIC CALCULATION
- A. Sleeping more than 8 hours causes a higher GPA for all students in the district.
- B. There is an association between sleep and GPA that can be generalized to the district, but a causal conclusion is not supported.
- C. There is a causal relationship between sleep and GPA, but only for these 200 students.
- D. Higher GPA causes students to sleep more.
- E. The results cannot be generalized because the sample is too small.
Show answer (B)
Question 3: INTERMEDIATE
- A. Association only, limited to the 500 participants
- B. Causal conclusion, limited to the 500 participants
- C. Association only, generalizable to the city's adult population
- D. Causal conclusion, generalizable to the city's adult population
- E. Causal conclusion, generalizable to all adults everywhere
Show answer (D)
Question 4: APPLIED
4 ptsShow answer
Question 5: CRITICAL THINKING
4 ptsShow answer
SUMMARY
Lesson Summary
Summary
The ability to draw valid inferences from data depends entirely on study design. Only experiments with random assignment support cause-and-effect conclusions, because randomization balances both known and unknown confounding variables across groups. Observational studies can detect associations but cannot eliminate confounders, so causal language is never appropriate for them.
The scope of inference is determined by two dimensions: random selection (enables generalization to the population) and random assignment (enables causal claims). A well-designed experiment with control, replication, and blinding maximizes the strength of evidence. Always match your conclusion to the design: state causation only when random assignment justifies it, and limit your generalization to the population from which the sample was drawn.