

SECTION 1
Historical Context & Motivation
The question of whether collected data faithfully represent reality is as old as systematic inquiry itself. Long before formal statistical theory existed, governments conducted censuses and merchants kept ledgers, yet the reliability of such records was perpetually in doubt. The modern discipline of statistics arose precisely because scholars recognized that raw numbers can mislead as easily as they can illuminate—what matters is how data are collected, not merely that they exist.
1662 • John Graunt's Bills of Mortality
1936 • The Literary Digest Debacle
1948 • Dewey Defeats Truman—Except He Didn't
1965 • Fisher, Neyman, and Experimental Design
2020s • Big Data and Algorithmic Bias
The central thread running through every episode above is a single, persistent question: Do the data we collected actually tell the truth about the population or process we care about? Answering that question requires understanding how bias infiltrates data collection, how variability arises in samples, and what design principles guard against misleading conclusions. This lesson introduces the conceptual framework that the entire AP Statistics course builds upon.
SECTION 2
Core Principles & Definitions
Before we can evaluate whether data "tell the truth," we need a shared vocabulary. The discipline of statistics distinguishes sharply between the group we want to learn about and the subset we actually observe, between values that summarize samples and values that describe populations, and between studies that can establish causation and those that can only suggest association. These distinctions are not pedantic—they determine the scope of every conclusion we draw.
Population vs. Sample
Parameter vs. Statistic
Bias vs. Variability
Observational Study vs. Experiment
Confounding Variables
KEY TAKEAWAY
SECTION 3
Visualizing Bias and Variability
The classic "bullseye" diagram is the most intuitive way to understand the interplay between bias and variability. Imagine that each dot on the target represents a sample statistic obtained from a separate random sample drawn by the same method. The center of the target represents the true population parameter. The pattern of dots reveals whether our data collection method systematically misses the mark (bias), scatters widely (high variability), or both.
Notice the crucial asymmetry between the two sources of error. Variability can be reduced by increasing the sample size—more data points tighten the cluster. Bias, however, does not diminish with larger samples; a flawed collection method will produce systematically skewed results no matter how many observations you gather. This is why the Literary Digest poll of 2.4 million respondents was less accurate than George Gallup's poll of only 50,000: the Digest's method was biased, and no amount of data could fix it. The lesson for AP Statistics is that the design of data collection is the first and most consequential decision in any study.
SECTION 4
How Data Collection Methods Determine Truth
The truthfulness of data is not an inherent property of the numbers themselves—it emerges from the process that generated them. In this section we formalize the key mechanisms through which collection methods shape what the data can and cannot tell us. Although the AP Statistics course does not require calculus-based derivations, understanding these foundational relationships equips you to evaluate any study you encounter.
Sampling Bias: When the Sample Does Not Represent the Population
When every member of the population does not have a known, nonzero chance of being selected, the resulting sample is prone to selection bias. The formal remedy is probability sampling, in which each unit's probability of inclusion is specified in advance. The simplest form is a simple random sample (SRS), where every subset of n units from the population of N is equally likely to be the chosen sample.
NUMBER OF POSSIBLE SIMPLE RANDOM SAMPLES
N = population size, n = sample size. In a true SRS, each of these C(N, n) subsets has probability 1/C(N, n) of being selected.
Sampling Variability and the Role of Sample Size
Even an unbiased sampling method produces statistics that vary from one sample to the next. The sampling distribution of a statistic describes the pattern of this variation across all possible samples. For the sample mean, the standard deviation of its sampling distribution—called the standard error—is governed by the population standard deviation σ and the sample size n.
STANDARD ERROR OF THE SAMPLE MEAN
σ = population standard deviation, n = sample size. Quadrupling the sample size halves the standard error—a fundamental result you will see repeatedly in inference.
Confounding and Causal Claims
When we wish to claim that one variable causes changes in another, observational data alone are insufficient because confounding variables may lurk behind any observed association. A well-designed randomized controlled experiment addresses this by randomly assigning subjects to treatment groups, which tends to balance both known and unknown confounders across groups. Random assignment does not eliminate variability—it ensures that the remaining variation is attributable to chance rather than to systematic differences between groups.
SCOPE OF INFERENCE RULE
A study may have both, one, or neither form of randomization. The presence or absence of each determines which conclusions are legitimate.
SECTION 5
Classifying Sources of Bias in Data Collection
Understanding bias requires more than knowing it exists—you must be able to identify its specific form, because different biases demand different remedies. On the AP Statistics exam, free-response questions frequently ask you to name the type of bias, explain the direction of its effect, and describe how the study design could be improved. The following taxonomy covers the major categories you will encounter.
Each branch in the diagram above corresponds to a distinct phase of data collection. Selection bias occurs before data are gathered, when the mechanism for choosing subjects systematically favors certain groups. Measurement bias occurs during data gathering, when the questions asked, the instruments used, or the observers' expectations distort the recorded values. Nonresponse bias occurs after subjects are selected but before data are recorded, when a substantial fraction of those chosen decline or fail to participate—and those nonrespondents differ meaningfully from those who do respond.
AP EXAM TIP
 A survey can lose people before selection or after invitation. Keeping the target population, sampling frame, selected sample and respondents separate reveals where each problem arises.
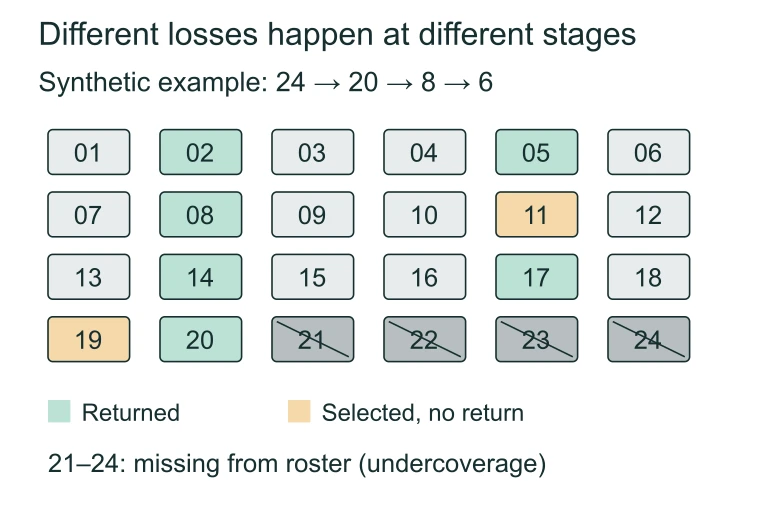 Suppose the target population has 24 IDs. The frame omits IDs 21–24; eight listed IDs are selected, and six respond. Frame omissions are undercoverage; selected people who do not respond are nonresponse. Bias direction depends on how missing responses differ.
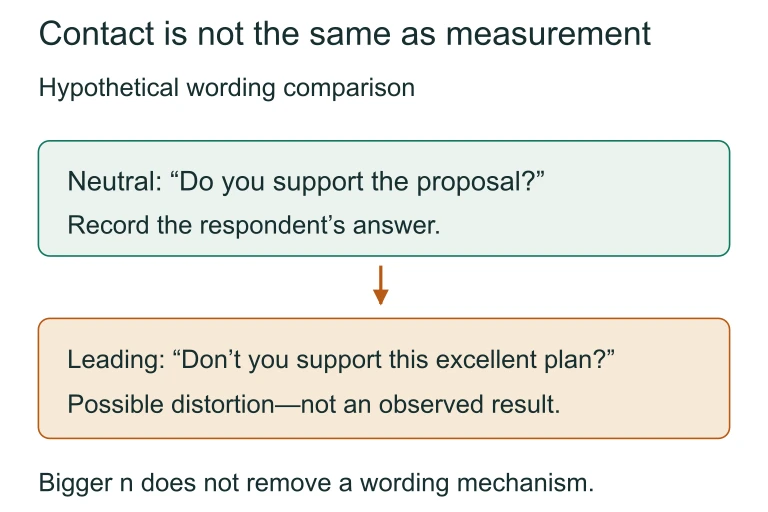 A respondent can still be influenced by the wording of a question. Compare the neutral and leading versions by identifying the assumption each asks the respondent to accept.
SECTION 6
Worked Example: Evaluating a Study Design
Consider the following scenario, which is typical of AP Statistics free-response questions. A university researcher wants to determine whether a new tutoring program improves exam scores. She posts flyers in the library inviting students to sign up for the program. Of the 120 students who volunteer, she randomly assigns 60 to receive tutoring and 60 to a control group. After eight weeks, the tutored group scores an average of 78 on the final exam compared to 72 for the control group. She concludes that the tutoring program is effective and should be adopted university-wide.
Analyzing the Validity of the Researcher's Conclusion
- 1
Step 1 — Identify the Type of Study
The researcher randomly assigned volunteers to treatment and control groups, so this is a randomized experiment. Because random assignment was used, confounding variables are likely balanced between the two groups, which supports a causal interpretation: the tutoring program likely caused the difference in scores.Study type: Randomized experiment → causal claim is potentially justified. - 2
Step 2 — Assess Random Selection
The participants were not randomly selected from the university population; they volunteered in response to library flyers. This constitutes a convenience/voluntary response sample. Students who frequent the library and proactively seek academic help may be more motivated than the average university student, introducing selection bias.No random selection → cannot generalize to all university students. - 3
Step 3 — Apply the Scope of Inference Framework
With random assignment but without random selection, the study falls into the category where we can claim causation (the tutoring caused higher scores among these participants), but we cannot generalize to the broader university population. The researcher's conclusion that the program "should be adopted university-wide" oversteps the scope of inference.Valid claim: tutoring caused improvement for these volunteers. Invalid claim: the effect generalizes university-wide. - 4
Step 4 — Suggest an Improved Design
To support a generalizable causal conclusion, the researcher could randomly select 120 students from the university enrollment roster (random selection) and then randomly assign them to tutoring and control conditions (random assignment). This two-stage randomization would allow both a causal interpretation and generalization to the full student body.Improved design: Random selection + random assignment = causal + generalizable.
SECTION 7
Strengths and Limitations of Data Collection Methods
No single data collection method is universally superior; each involves trade-offs among cost, practicality, ethical constraints, and the strength of conclusions it can support. The table below compares the major methods you will encounter in the AP Statistics curriculum, highlighting when each is most appropriate and where each can go wrong.
| Method | Strengths | Limitations |
|---|---|---|
| Census | No sampling variability; complete information about every individual in the population. | Often impractical or impossible for large populations; expensive, time-consuming, and still subject to measurement bias. |
| Simple Random Sample | Unbiased estimates; straightforward probability calculations; basis for statistical inference. | Requires a complete list of the population (sampling frame); may miss small subgroups by chance. |
| Stratified Random Sample | Guarantees representation from each stratum; reduces variability when strata differ from each other. | Requires advance knowledge of relevant strata; more complex logistics and analysis. |
| Observational Study | Ethical when manipulation would be harmful; can study variables that cannot be assigned (e.g., smoking). | Cannot establish causation due to lurking and confounding variables. |
| Randomized Experiment | Random assignment balances confounders; can support causal conclusions. | May lack generalizability if subjects are not randomly selected; ethical constraints limit feasible treatments. |
Comparison of major data collection methods in AP Statistics
KEY TAKEAWAY
SECTION 8
Connection to Statistical Inference
The data collection principles introduced here are not merely preamble—they form the logical foundation on which every subsequent inference procedure rests. When you construct confidence intervals or perform hypothesis tests later in the course, the validity of those procedures depends entirely on whether the data were collected using appropriate methods. The table below connects introductory concepts to their advanced counterparts.
| Introductory Concept | Advanced Connection |
|---|---|
| Sampling variability — statistics differ from sample to sample | Sampling distributions, Central Limit Theorem, and the basis for confidence intervals |
| Bias — systematic error in estimation | Conditions checks for inference (e.g., "random" condition); violations invalidate confidence intervals and tests |
| Random assignment in experiments | Two-sample t-tests and chi-square tests for independence; causal interpretation of significant results |
| Confounding variables | Simpson's paradox, multiple regression, stratification in observational studies |
| Scope of inference (generalize vs. cause) | Writing full inference conclusions that state both what can be claimed and to whom the claim applies |
How introductory data collection concepts underpin later inference topics
Every confidence interval you compute and every p-value you report implicitly assumes that the data were collected properly. A 95% confidence interval, for instance, has its advertised coverage rate only if the sample was drawn randomly from the population. If the sample is biased, the interval is centered on the wrong value, and no amount of mathematical sophistication can rescue the conclusion. This is why the AP Statistics exam devotes an entire unit to data collection before introducing a single inferential formula.
SECTION 9
Practice Problems
Question 1: CONCEPTUAL
- A. A parameter, because it describes the population of all adults in the city
- B. A statistic, because it is computed from a sample of 200 adults
- C. A parameter, because it was obtained through random selection
- D. A confounding variable, because voter registration status could influence blood pressure
- E. A census result, because the researcher used a voter registration list
Show answer (B)
Question 2: BASIC CALCULATION
- A. This is a stratified random sample because students are numbered systematically
- B. This is a simple random sample, and increasing the sample size to 240 would reduce the standard error to one-quarter of its original value
- C. This is a simple random sample, and the results can be generalized to the school's student population
- D. This is a convenience sample because the principal selected students who were easy to number
- E. This is a cluster sample because the principal selected students in groups
Show answer (C)
Question 3: INTERMEDIATE
- A. The sample size of 15,000 is too small to detect a meaningful effect
- B. The study lacks a control group, so the observed effect could be due to the placebo effect or confounding variables, and the voluntary response sample likely overrepresents people with strong opinions
- C. The 72% result should have been reported as a parameter rather than a statistic
- D. The survey should have used a larger font to reduce measurement error
- E. The standard error of the sample proportion is too large with this sample size
Show answer (B)
Question 4: APPLIED
4 ptsShow answer
Question 5: CRITICAL THINKING
4 ptsShow answer
SUMMARY
Lesson Summary
Summary
Whether data "tell the truth" depends entirely on the method used to collect them. The distinction between a population and a sample is foundational: we almost always work with samples, and the quality of our conclusions depends on how those samples were drawn. A parameter is a fixed numerical truth about the population, while a statistic is its estimate from the sample. Two enemies of trustworthy data are bias (systematic error that cannot be reduced by collecting more data) and variability (random fluctuation that decreases with larger samples).
The three major families of bias— selection bias, measurement bias, and nonresponse bias—are combated through probability sampling, careful instrument design, and follow-up protocols, respectively. The scope of inference framework ties everything together: random selection allows generalization to the population, and random assignment allows cause-and-effect conclusions. A study may have both, one, or neither—and your job on the AP exam is to identify which forms of randomization are present and state the corresponding conclusions accurately.