

SECTION 1
Historical Context & Motivation
Understanding the relationship between two categorical variables has been a central challenge in statistical analysis since the nineteenth century. When a researcher asks whether smoking status is associated with lung disease, or whether political affiliation differs across age groups, the raw counts in a two-way table (also called a contingency table) provide the starting point. However, observed counts alone cannot tell us whether a pattern is statistically meaningful or merely the product of random variation. To answer that question, we need a benchmark — a set of counts that represents what we would see if the two variables had no association at all. These benchmarks are called expected counts, and they form the theoretical backbone of every chi-square test for independence and homogeneity.
1900 • Pearson's Chi-Square
1922 • Fisher's Exact Test
1954 • Cochran's Guidelines
2000s • Modern AP Curriculum
The central question expected counts address is deceptively simple: If two categorical variables were completely independent, how many observations would fall into each cell of a two-way table? Answering this question precisely is what allows us to measure the discrepancy between what we observe and what independence predicts, ultimately powering the chi-square statistic.
SECTION 2
Core Principles & Definitions
Before computing expected counts, it is essential to internalize several foundational ideas that connect probability theory to the structure of contingency tables. These principles ensure you understand not just how to calculate expected counts but why the formula works.
Independence Assumption
Marginal Totals
Expected Count Formula
Not Necessarily Integers
Validity Condition
KEY TAKEAWAY
SECTION 3
Visual Explanation
The following diagram illustrates a complete two-way table for a study examining the relationship between exercise frequency (Low, Moderate, High) and health outcome (Healthy, Unhealthy). Observed counts are shown in each cell alongside their row and column marginal totals. The diagram highlights how each cell's expected count derives from its corresponding row total and column total divided by the grand total.
In the diagram above, notice that the observed count for the Healthy-Low cell is 30, but the expected count under independence is 48. This discrepancy is precisely the kind of deviation the chi-square test measures. Each cell's expected count preserves the marginal distributions: the expected values in the Healthy row still sum to 150, and those in the Low column still sum to 80, ensuring overall consistency with the data's structure.
SECTION 4
Mathematical Framework
The expected count formula is a direct consequence of the multiplication rule for independent events. If the row variable and column variable are independent, then the probability that a randomly selected observation falls in row i and column j equals the product of the marginal probabilities. Multiplying that joint probability by the grand total gives the expected count.
INDEPENDENCE CONDITION
Under the null hypothesis of independence, the joint probability of being in row i and column j equals the product of the two marginal probabilities.
EXPECTED COUNT FORMULA
Where Eij = expected count for row i and column j, Ri = total for row i, Cj = total for column j, and n = grand total of all observations.
To see why this formula works, consider that P(Row i) is estimated by Ri / n and P(Col j) is estimated by Cj / n. Under independence, the expected proportion in cell (i, j) is (Ri / n) × (Cj / n). Multiplying by n yields (Ri × Cj) / n, which is the standard formula. This derivation makes clear that expected counts allocate the grand total across cells in exact proportion to the marginal distributions.
CHI-SQUARE TEST STATISTIC
The chi-square statistic sums the squared differences between observed (Oij) and expected (Eij) counts, each divided by the expected count, over all cells. Larger values indicate greater departure from independence.
DEGREES OF FREEDOM
Where r = number of rows and c = number of columns. For a 2 × 3 table, df = (2 − 1)(3 − 1) = 2.
SECTION 5
Building the Complete Expected-Count Table
Returning to our exercise-and-health example, let us compute the expected count for every cell and display the full table side by side with the observed counts. This comparison provides immediate visual insight into which cells contribute most to the chi-square statistic. When computing expected counts, always use unrounded intermediate values; rounding prematurely introduces error that compounds in the chi-square calculation.
Consistency Check
SECTION 6
Worked Example
A university admissions office wants to investigate whether admission status (Admitted, Denied) is associated with the applicant's intended major (Engineering, Business, Liberal Arts). A random sample of 400 applicants yields the following observed counts.
| Engineering | Business | Liberal Arts | Row Total | |
|---|---|---|---|---|
| Admitted | 80 | 60 | 100 | 240 |
| Denied | 40 | 60 | 60 | 160 |
| Col Total | 120 | 120 | 160 | 400 |
Observed counts for admission status vs. intended major
Computing Expected Counts & Chi-Square Statistic
- 1
Step 1 — Identify Marginal Totals
Row totals: Admitted = 240, Denied = 160. Column totals: Engineering = 120, Business = 120, Liberal Arts = 160. Grand total n = 400. - 2
Step 2 — Compute Expected Counts
Apply Eij = (Ri × Cj) / n for each cell. Admitted-Engineering: (240 × 120)/400 = 72. Admitted-Business: (240 × 120)/400 = 72. Admitted-Liberal Arts: (240 × 160)/400 = 96. Denied-Engineering: (160 × 120)/400 = 48. Denied-Business: (160 × 120)/400 = 48. Denied-Liberal Arts: (160 × 160)/400 = 64.Expected counts: 72, 72, 96, 48, 48, 64 — all ≥ 5 ✓ - 3
Step 3 — Verify Marginal Sums
Admitted row: 72 + 72 + 96 = 240 ✓. Denied row: 48 + 48 + 64 = 160 ✓. Engineering column: 72 + 48 = 120 ✓. Business column: 72 + 48 = 120 ✓. Liberal Arts column: 96 + 64 = 160 ✓. - 4
Step 4 — Compute Chi-Square Contributions
For each cell, compute (O − E)² / E. Admitted-Eng: (80 − 72)² / 72 = 64/72 ≈ 0.889. Admitted-Bus: (60 − 72)² / 72 = 144/72 = 2.000. Admitted-LA: (100 − 96)² / 96 = 16/96 ≈ 0.167. Denied-Eng: (40 − 48)² / 48 = 64/48 ≈ 1.333. Denied-Bus: (60 − 48)² / 48 = 144/48 = 3.000. Denied-LA: (60 − 64)² / 64 = 16/64 = 0.250. - 5
Step 5 — Sum and Interpret
χ² = 0.889 + 2.000 + 0.167 + 1.333 + 3.000 + 0.250 = 7.639. Degrees of freedom: (2 − 1)(3 − 1) = 2. Using a chi-square distribution with df = 2, the p-value is approximately 0.022. At α = 0.05, we reject the null hypothesis and conclude that there is statistically significant evidence of an association between admission status and intended major.χ² = 7.639, df = 2, p ≈ 0.022 → Reject H₀ at α = 0.05
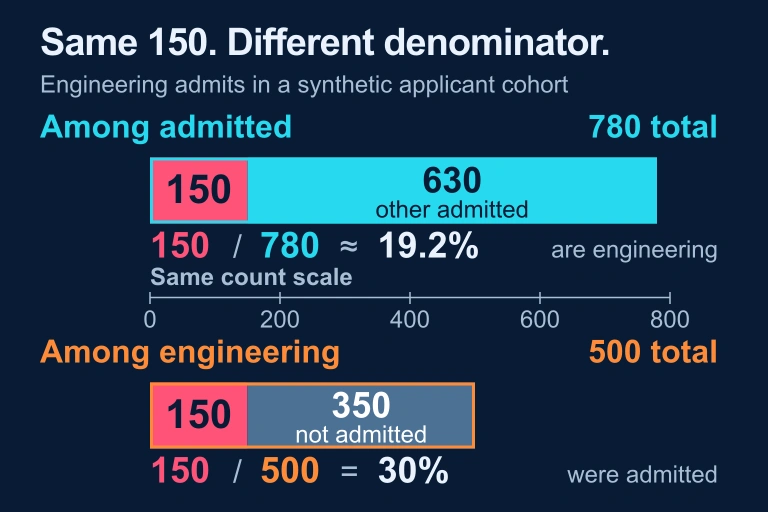
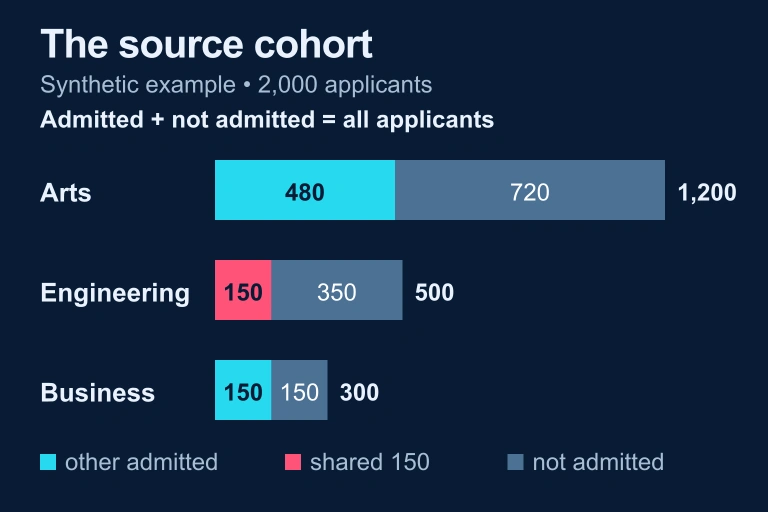 Applicant cohorts of 1200,500,300 with admitted counts 480,150,150 and other counts 720,350,150.
Separate 2,000-applicant illustration: an expected count here is 500×780/2000=195. Preserve the original 400-observation table with expected rows [72,72,96] and [48,48,64].
SECTION 7
Common Pitfalls & Exam Tips
| Common Pitfall | Why It's Wrong | Correct Approach |
|---|---|---|
| Using observed counts in the denominator of the χ² formula | The formula divides by expected counts, not observed counts. Using observed counts changes the distribution of the test statistic. | Always divide (O − E)² by E, the expected count. |
| Rounding expected counts to whole numbers | Expected counts are theoretical values and need not be integers. Premature rounding introduces unnecessary error. | Keep at least two decimal places throughout all calculations. |
| Ignoring the validity condition | If any expected count is below 5, the χ² distribution is a poor approximation, and the p-value may be unreliable. | State that all expected counts are ≥ 5 as part of your conditions check on the AP exam. |
| Confusing the test for independence with the test for homogeneity | Both use the same χ² formula and expected count calculation, but the sampling designs differ (one sample vs. separate samples from each population). | Identify the study design first. Hypotheses and calculations remain the same; interpretation and context differ. |
| Computing expected counts using proportions from the sample instead of the formula | While conceptually equivalent, manually multiplying proportions increases the risk of rounding error compared to the direct formula. | Use E = (Row Total × Column Total) / Grand Total directly. |
Common mistakes and corrections for expected count calculations
AP EXAM STRATEGY
SECTION 8
Connection to Advanced Topics
Expected counts in two-way tables form the gateway to a broader family of chi-square procedures and advanced categorical analysis. Understanding expected counts thoroughly prepares you not only for the AP exam but also for more sophisticated methods you may encounter in college-level statistics or data science coursework.
| Feature | Expected Counts (AP Level) | Advanced Extensions |
|---|---|---|
| Table size | r × c tables with moderate cell counts | Multi-way tables (3+ variables) analyzed via log-linear models |
| Small expected counts | Combine categories or note violation | Fisher's exact test, simulation-based tests, or exact conditional inference |
| Effect size | Chi-square statistic and p-value | Cramér's V, phi coefficient, standardized residuals for individual cells |
| Model complexity | Test for independence or homogeneity | Logistic regression, generalized linear models for categorical response |
| Interpretation focus | Is there an association? (yes/no) | Which specific cells deviate most? What is the nature and direction of the association? |
AP-level expected counts vs. advanced categorical analysis
One particularly useful extension is the concept of standardized residuals, defined as (O − E) / √E for each cell. While the AP exam focuses on the overall χ² statistic, standardized residuals allow researchers to pinpoint which specific cells contribute most to a significant result. A standardized residual exceeding ±2 suggests that particular cell deviates substantially from what independence predicts — a technique that bridges the gap between the simple hypothesis test and deeper exploratory analysis of categorical data.
SECTION 9
Practice Problems
Question 1: CONCEPTUAL
- A. The number of observations actually recorded in that cell from the sample data.
- B. The count that would appear in the cell if the two categorical variables were perfectly correlated.
- C. The count that would appear in the cell if the two categorical variables were independent, given the observed marginal totals.
- D. The mean of the observed counts across all cells in the table.
- E. The count obtained by evenly distributing the grand total across all 12 cells.
Show answer (C)
Question 2: BASIC CALCULATION
- A. 15
- B. 18
- C. 25
- D. 30
- E. 50
Show answer (B)
Question 3: INTERMEDIATE
- A. 0.25
- B. 1.00
- C. 1.40
- D. 1.75
- E. 7.00
Show answer (C)
Question 4: APPLIED
5 ptsShow answer
Question 5: CRITICAL THINKING
4 ptsShow answer
SUMMARY
Summary
Summary
Expected counts represent the theoretical cell frequencies in a two-way table under the null hypothesis of independence between two categorical variables. They are computed using the formula E = (Row Total × Column Total) / Grand Total, which distributes the grand total across cells in exact proportion to the marginal distributions. Expected counts need not be integers, should never be rounded for calculations, and must each be at least 5 for the chi-square approximation to be valid.
The chi-square test statistic is computed as χ² = Σ (O − E)² / E, summing over all cells, and is compared to a chi-square distribution with df = (r − 1)(c − 1). On the AP exam, always verify the expected count condition explicitly, present your expected counts clearly, and interpret your results in the context of the problem. Mastering expected counts is essential for both the chi-square test for independence and the chi-square test for homogeneity.