

SECTION 1
Historical Context & Motivation
Comparing proportions across two groups is one of the most common tasks in applied research. Whether a medical team wants to know if a new vaccine reduces infection rates relative to a placebo, or a marketing analyst asks whether an email redesign lifts click-through rates, the underlying statistical question is the same: do the two population proportions p₁ and p₂ differ? The formal machinery for answering this question grew out of more than a century of work in probability theory, normal approximation, and hypothesis testing.
1733 • De Moivre's Normal Approximation
1900 • Pearson's Chi-Square Test
1925 • Fisher & Neyman–Pearson Frameworks
1970s–Present • Modern Curriculum & AP Statistics
The central question this lesson addresses is straightforward yet powerful: given sample data from two independent groups, how do we formally test whether the difference in their sample proportions provides convincing evidence that the corresponding population proportions are truly different? Answering that question requires a pooled estimate, a test statistic, and a p-value—each of which we will develop step by step.
SECTION 2
Core Principles & Definitions
Before computing anything, it is essential to understand the conceptual building blocks of the two-proportion z-test. The test compares two independent groups on a single binary outcome—success or failure—and asks whether any observed difference in sample proportions is large enough to rule out chance as a plausible explanation.
Null & Alternative Hypotheses
Pooled Proportion (p̂_c)
Standard Error (Pooled)
Test Statistic (z)
P-Value & Decision
SECTION 3
Visual Explanation — The Testing Procedure
The flowchart reinforces a critical point: the computation of the test statistic (Step 4) depends on the pooled proportion, which is only appropriate when we assume H₀: p₁ = p₂. If you were instead constructing a confidence interval for p₁ − p₂, you would use unpooled standard error—a distinction worth remembering on exam day.
SECTION 4
Mathematical Framework
The two-proportion z-test rests on the sampling distribution of p̂₁ − p̂₂. When both samples are sufficiently large and drawn independently, the Central Limit Theorem guarantees that p̂₁ − p̂₂ is approximately normal. Under H₀: p₁ − p₂ = 0, the mean of this distribution is 0 and we estimate its standard deviation with the pooled standard error.
POOLED PROPORTION
X₁ and X₂ are the number of successes in samples 1 and 2; n₁ and n₂ are the respective sample sizes. This single proportion is our best estimate of the common p under H₀.
POOLED STANDARD ERROR
This expression combines the variability from both samples. The factor (1/n₁ + 1/n₂) captures that larger samples yield smaller standard errors.
TEST STATISTIC
We subtract 0 because the hypothesized difference under H₀ is zero. The resulting z follows approximately the standard normal distribution N(0, 1) when conditions are met.
P-VALUE
Z is a standard normal random variable. Use the direction indicated by Hₐ. On the AP exam, you may use a calculator's 2-PropZTest function or Table A.
SECTION 5
Sampling Distribution & Condition Details
Understanding why conditions matter requires visualizing the sampling distribution of p̂₁ − p̂₂ under the null hypothesis. When H₀ is true, the distribution is centered at 0 with a spread determined by the pooled standard error. The diagram below illustrates how the observed difference maps onto this distribution to produce a p-value.
Why Each Condition Matters
| Condition | What Could Go Wrong | How to Verify |
|---|---|---|
| Random | Without randomness, sampling bias may make p̂₁ and p̂₂ unrepresentative, invalidating any inference. | Confirm random sampling (observational study) or random assignment (experiment) in the problem stem. |
| Independence (10%) | Dependent observations produce a smaller true SE than assumed, inflating the z-statistic and yielding spurious significance. | Check n₁ ≤ 0.10 × N₁ and n₂ ≤ 0.10 × N₂, or note random assignment in an experiment (which guarantees independence). |
| Large Counts | If expected counts are too small, the normal approximation is poor and the stated p-value may be inaccurate. | Verify n₁p̂_c ≥ 10, n₁(1−p̂_c) ≥ 10, n₂p̂_c ≥ 10, n₂(1−p̂_c) ≥ 10 using the pooled proportion. |
Three conditions for the two-proportion z-test
SECTION 6
Worked Example
A researcher randomly assigns 250 patients to receive a new drug and 250 patients to receive a placebo. In the drug group, 180 out of 250 show symptom improvement. In the placebo group, 155 out of 250 show improvement. At α = 0.05, is there convincing evidence that the drug produces a higher improvement rate than the placebo?
Worked example
- 1
Step 1 — State Hypotheses
Let p₁ = the true proportion who improve with the drug and p₂ = the true proportion who improve with the placebo. H₀: p₁ − p₂ = 0 (no difference). Hₐ: p₁ − p₂ > 0 (the drug is better). This is a one-sided test (right-tailed). - 2
Step 2 — Check Conditions
Random: Patients were randomly assigned to treatment groups. ✓ Independent: Random assignment supports the treatment comparison. The z-test also assumes independent individual responses and no material clustering or interference; these conditions must be justified by the study design. Large Counts: We need p̂_c first (computed in Step 3): p̂_c = 0.67. Then n₁p̂_c = 250 × 0.67 = 167.5 ≥ 10, n₁(1−p̂_c) = 82.5 ≥ 10, n₂p̂_c = 167.5 ≥ 10, n₂(1−p̂_c) = 82.5 ≥ 10. ✓ The large-count condition is met; the analysis is conditional on the independence assumptions above. - 3
Step 3 — Compute Pooled Proportion
p̂₁ = 180/250 = 0.72. p̂₂ = 155/250 = 0.62. The pooled proportion is:p̂_c = (180 + 155) / (250 + 250) = 335 / 500 = 0.67 - 4
Step 4 — Compute Standard Error
SE = √[ 0.67 × 0.33 × (1/250 + 1/250) ] = √[ 0.2211 × 0.008 ] = √0.001769SE ≈ 0.04206 - 5
Step 5 — Compute Test Statistic
z = (p̂₁ − p̂₂) / SE = (0.72 − 0.62) / 0.04206 = 0.10 / 0.04206z ≈ 2.377 - 6
Step 6 — Find P-Value
Since Hₐ is one-sided (>), the p-value = P(Z ≥ 2.377). Using the standard normal table or calculator: p-value ≈ 0.0087.p-value ≈ 0.0087 - 7
Step 7 — State Conclusion in Context
Conditional on those study-design assumptions, because the p-value (0.0087) is less than α = 0.05, we reject H₀. There is convincing evidence that the proportion of patients who improve is higher for the drug group than for the placebo group.
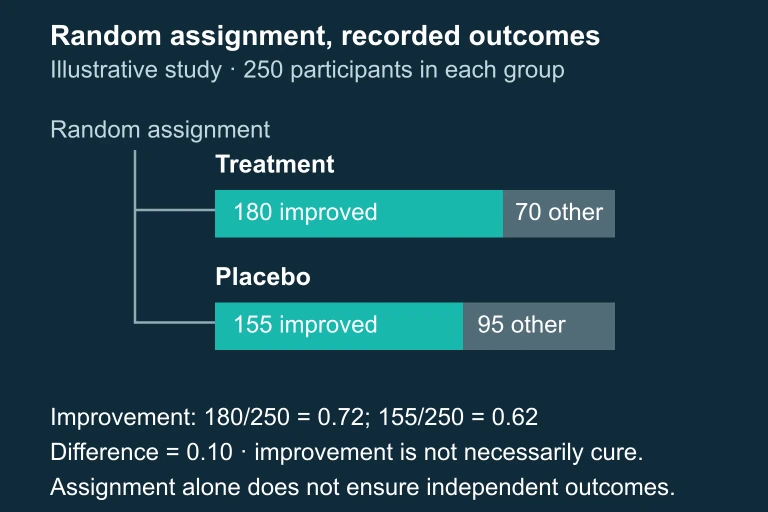 The assigned treatment and placebo groups have observed improvement fractions 0.72 and 0.62; random assignment does not by itself guarantee independent outcomes.
SECTION 7
Common Errors & Exam Pitfalls
| Mistake | Why It's Wrong | Correct Approach |
|---|---|---|
| Using unpooled SE in the hypothesis test | Under H₀ both populations share one proportion; using separate p̂ values overestimates or underestimates SE. | Always use the pooled proportion p̂_c for the SE in a significance test. |
| Using pooled SE in a confidence interval | A CI does not assume H₀ is true, so pooling is inappropriate. | Use unpooled SE = √[ p̂₁(1−p̂₁)/n₁ + p̂₂(1−p̂₂)/n₂ ] for CIs. |
| Checking Large Counts with p̂₁ and p̂₂ separately | The conditions for the test require expected counts under H₀, which means using p̂_c. | Verify all four: n₁p̂_c, n₁(1−p̂_c), n₂p̂_c, n₂(1−p̂_c) ≥ 10. |
| Generic conclusion not linked to context | AP rubrics require a conclusion stated in terms of the problem's variables and scenario. | Mention the populations, the variable, and use non-definitive language ('convincing evidence'). |
| Confusing 'fail to reject H₀' with 'accept H₀' | We never prove H₀ true; we only say the data do not provide sufficient evidence against it. | Write: 'We do not have convincing evidence that p₁ ≠ p₂.' |
Common exam-day errors and how to avoid them
SECTION 8
Connection to Chi-Square & Advanced Methods
The two-proportion z-test is closely related to the chi-square test of homogeneity. In fact, for a two-sided test comparing two proportions, the chi-square statistic with 1 degree of freedom equals z² exactly. The z-test, however, has the advantage of supporting one-sided alternatives and directly producing a signed test statistic that indicates the direction of the difference. As you advance, you will encounter logistic regression, which generalizes proportion comparisons to multiple predictors, and Fisher's exact test, which handles very small samples where the normal approximation fails.
| Feature | Two-Proportion z-Test | Chi-Square Test of Homogeneity |
|---|---|---|
| Number of groups | Exactly 2 | 2 or more |
| One-sided Hₐ possible? | Yes | No (always two-sided) |
| Test statistic | z (standard normal) | χ² (chi-square with df = (r−1)(c−1)) |
| Relationship | z² = χ² when df = 1 and Hₐ is two-sided | Generalizes the z-test to multi-group settings |
| When to prefer | Directional hypotheses or when you need a CI | Comparing 3+ groups or when direction is not specified |
Two-proportion z-test vs. chi-square test of homogeneity
Looking ahead, techniques such as logistic regression allow researchers to compare proportions while controlling for confounding variables—something the simple z-test cannot do. Mastering the two-proportion z-test builds the conceptual foundation you will need for these more advanced methods.
SECTION 9
Practice Problems
Question 1: CONCEPTUAL
- A. Because pooling always reduces Type I error regardless of the hypothesis.
- B. Because the null hypothesis assumes both populations share a common proportion, so combining the samples gives the best estimate of that shared value for the SE calculation.
- C. Because using separate proportions would make the z-statistic too large.
- D. Because pooling is required by the Central Limit Theorem.
- E. Because pooled and unpooled standard errors always give the same test statistic.
Show answer (B)
Question 2: BASIC CALCULATION
- A. 0.42
- B. 0.30
- C. 0.36
- D. 0.72
- E. 0.21
Show answer (C)
Question 3: INTERMEDIATE
- A. 0.70
- B. 1.40
- C. 1.87
- D. 2.09
- E. 2.63
Show answer (D)
Question 4: APPLIED
Show answer
Question 5: CRITICAL THINKING