

SECTION 1
Historical Context & Motivation
The ability to draw rigorous conclusions from data did not emerge overnight; it developed through centuries of work by mathematicians and scientists grappling with uncertainty. The modern framework for hypothesis testing traces its roots to early probability theory and formalized statistical reasoning in the twentieth century. Understanding this history helps reveal why the conclusion step of a significance test—comparing a p-value to a significance level and writing a contextual interpretation—carries so much weight. Earlier statisticians recognized that simply computing a number was never enough; the real power of inference lies in translating that number into a defensible claim about the world.
1710 • Arbuthnot's Significance Argument
1900 • Pearson's Chi-Square Test
1925 • Fisher Formalizes P-Values
1933 • Neyman–Pearson Framework
2019 • ASA Statement on P-Values
This historical arc reveals a persistent theme: computing a test statistic or p-value is only part of the work. The conclusion step—stating whether the evidence is convincing, linking back to the original claim, and using proper statistical language—is what transforms arithmetic into inference. In this lesson we focus exclusively on that final, critical phase: how to correctly conclude a one-proportion z-test on the AP Statistics exam and in applied research.
SECTION 2
Core Principles of Drawing a Conclusion
Drawing a conclusion from a one-proportion z-test requires you to connect a computed p-value (or z-statistic) back to the real-world question that motivated the test. The conclusion is not merely a yes-or-no verdict; it is a carefully worded statement that accounts for the hypotheses, the significance level, and the context of the data. The following foundational ideas govern this final step.
Compare p-value to α
Never 'Accept' H₀
State the Conclusion in Context
Address Type I and Type II Error
Link Evidence to the Alternative
KEY TAKEAWAY
SECTION 3
Visual Explanation: The Decision Diagram
The flowchart below maps the complete logic of concluding a one-proportion z-test. Starting from the computed p-value, it branches into the two possible decisions and shows the template language expected on the AP Statistics exam. Notice that every pathway ends with a contextual statement—this is non-negotiable for full credit.
The diagram highlights a crucial structural point: every conclusion has exactly two components. First, a formal decision (reject or fail to reject H₀) justified by the comparison of the p-value to α. Second, an interpretation in context that references the parameter, the population, and the direction of the alternative hypothesis. The AP scoring guidelines consistently award separate points for each component, so omitting either one will cost you credit.
SECTION 4
Mathematical Framework for the Conclusion
Before you can write a conclusion, the test machinery must produce a test statistic and a p-value. Understanding these formulas is essential because your conclusion must logically follow from them. Below are the key equations and decision rules that lead to the final step.
ONE-PROPORTION Z-TEST STATISTIC
where p̂ is the sample proportion, p₀ is the hypothesized population proportion from H₀, and n is the sample size. The denominator is the standard error computed under the assumption that H₀ is true.
P-VALUE DEFINITION
For a one-sided test Hₐ: p > p₀, the p-value is the area to the right of z on the standard normal curve. For Hₐ: p < p₀, it is the area to the left. For a two-sided test Hₐ: p ≠ p₀, the p-value is twice the area in the more extreme tail.
DECISION RULE
The significance level α (commonly 0.05, 0.01, or 0.10) is specified before examining the data. The comparison is a strict inequality boundary: when the p-value exactly equals α, convention is to reject H₀.
AP Exam Tip
p-value = 0.023 < α = 0.05 before your reject/fail-to-reject statement ensures full credit for the linkage. Simply writing 'the p-value is small' without comparing it to a specific α is insufficient.SECTION 5
Detailed Breakdown: Writing the Conclusion Statement
The language of a statistical conclusion is precise and formulaic by design. The AP Statistics rubric consistently rewards students who hit specific wording checkpoints, and it penalizes common errors such as saying 'accept H₀' or failing to reference the context. This section dissects the anatomy of a correct conclusion statement and provides a visual reference for both reject and fail-to-reject scenarios.
Let us walk through each element shown in the diagram. Element 1 states the computed p-value as a number, providing transparency about the evidence. Element 2 is the comparison operator (< or >), which explicitly links the p-value to α. Element 3 names the significance level so the reader knows the threshold used. Element 4 gives the formal statistical decision: 'reject H₀' or 'fail to reject H₀.' Finally, Element 5 interprets the decision in the real-world context of the problem, referencing the parameter (the true population proportion), the population, and the direction stated in Hₐ. Omitting Element 5 is the single most common reason students lose points on the AP exam.
Critical Vocabulary
SECTION 6
Worked Example: Full Hypothesis Test with Conclusion
A hospital administrator claims that fewer than 15% of patients discharged from the emergency department are readmitted within 30 days. A random sample of 200 discharged patients reveals that 22 were readmitted. At the α = 0.05 significance level, is there convincing evidence that the readmission rate is less than 15%?
One-Proportion z-Test for Hospital Readmission Rate
- 1
Step 1 — State the Hypotheses
Define p as the true proportion of all emergency department patients at this hospital who are readmitted within 30 days. The null hypothesis is H₀: p = 0.15 and the alternative hypothesis is Hₐ: p < 0.15. This is a one-sided (left-tailed) test because the administrator's claim suggests the rate is below 15%. - 2
Step 2 — Check Conditions
Random: The sample is described as a random sample of 200 discharged patients. ✓ Independence: Assuming the hospital discharges far more than 10 × 200 = 2,000 patients, the 10% condition is met. ✓ Large Counts: np₀ = 200(0.15) = 30 ≥ 10 and n(1 − p₀) = 200(0.85) = 170 ≥ 10, so the normal approximation is appropriate. ✓ - 3
Step 3 — Compute the Test Statistic
The sample proportion is p̂ = 22/200 = 0.11. The standard error under H₀ is √(0.15 × 0.85 / 200) = √(0.1275 / 200) = √0.0006375 ≈ 0.02525. Therefore, z = (0.11 − 0.15) / 0.02525 = −0.04 / 0.02525 ≈ −1.584.z ≈ −1.584 - 4
Step 4 — Find the P-Value
Because this is a left-tailed test (Hₐ: p < 0.15), the p-value is P(Z ≤ −1.584). Using a standard normal table or calculator: p-value ≈ 0.0566.p-value ≈ 0.0566 - 5
Step 5 — State the Conclusion
Because the p-value (0.0566) is greater than α = 0.05, we fail to reject H₀. There is not convincing evidence that the true proportion of emergency department patients at this hospital who are readmitted within 30 days is less than 0.15.Fail to reject H₀ — not convincing evidence that p < 0.15
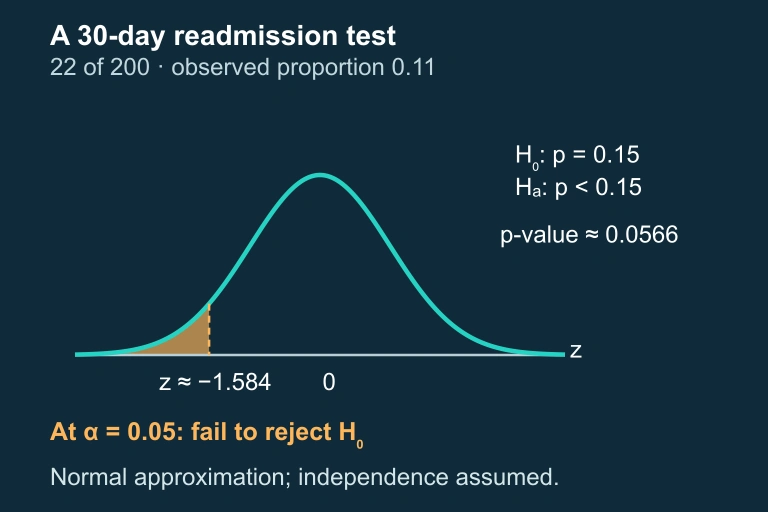 Population proportion p appears in the hypotheses; the separate p-value is approximately 0.0566.
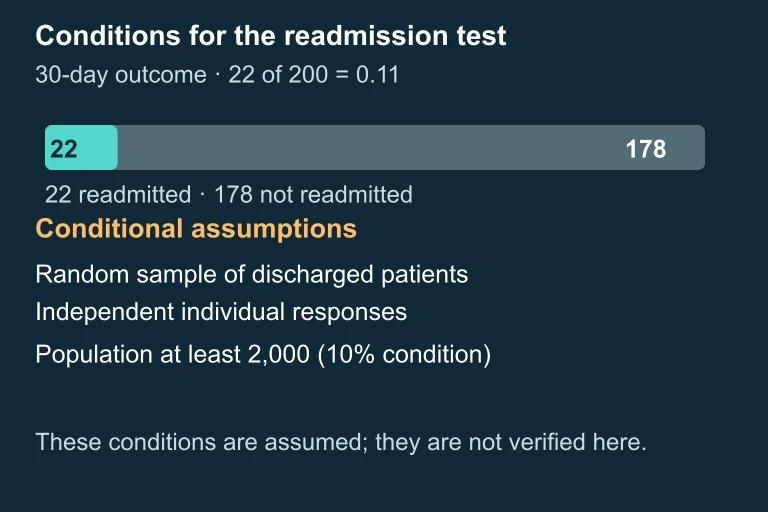 Population proportion p appears in the hypotheses; the separate p-value is approximately 0.0566.
Why Step 5 Matters Most
SECTION 7
Type I Error, Type II Error, and Power
Every conclusion you draw in a hypothesis test carries the possibility of error. The type of error that is possible depends directly on the conclusion you reach. Understanding these errors—and being able to describe their consequences in context—is a required component of many AP free-response questions.
| Scenario | Decision | Error Type | Consequence in Context |
|---|---|---|---|
| H₀ is true, we reject H₀ | Reject H₀ | Type I Error | We conclude the readmission rate is below 15% when it actually is 15%—possibly leading the hospital to reduce follow-up resources prematurely. |
| H₀ is true, we fail to reject H₀ | Fail to reject H₀ | Correct decision ✓ | We correctly identify that there is not enough evidence the rate is below 15%. |
| Hₐ is true, we reject H₀ | Reject H₀ | Correct decision ✓ | We correctly detect that the readmission rate is below 15%. |
| Hₐ is true, we fail to reject H₀ | Fail to reject H₀ | Type II Error | We fail to detect that the rate is actually below 15%—missing an opportunity to recognize the hospital's improvement. |
The four possible outcomes of a hypothesis test, showing which error type corresponds to each combination of truth and decision.
KEY TAKEAWAY
SECTION 8
Connection to Confidence Intervals and Two-Proportion Tests
The conclusion of a one-proportion z-test does not exist in isolation; it connects to the broader inferential framework you will encounter throughout AP Statistics. Two key connections deserve attention: the relationship between hypothesis tests and confidence intervals, and the extension to comparing two population proportions.
| Feature | One-Proportion z-Test | One-Proportion z-Interval | Two-Proportion z-Test |
|---|---|---|---|
| Question answered | Is there convincing evidence that p differs from p₀? | What is a plausible range for p? | Is there convincing evidence that p₁ ≠ p₂? |
| Standard error uses | p₀ (hypothesized value) | p̂ (sample proportion) | p̂ₓ (pooled proportion) |
| Output | z-statistic and p-value | Interval estimate (p̂ ± z*·SE) | z-statistic and p-value |
| Conclusion format | Reject or fail to reject H₀ in context | "We are C% confident that p is between…" | Reject or fail to reject H₀ about p₁ − p₂ in context |
Comparing the one-proportion z-test conclusion to related inference procedures.
A powerful consistency check arises from the duality between hypothesis tests and confidence intervals: for a two-sided test at significance level α, rejecting H₀ is equivalent to observing that p₀ falls outside the corresponding (1 − α) × 100% confidence interval for p. If you construct a 95% confidence interval and it does not contain p₀, a two-sided test at α = 0.05 would reject H₀. This equivalence does not hold exactly for one-sided tests, but conceptually, the interval provides complementary information—estimating the parameter rather than testing a specific claim about it. As you progress to two-proportion inference, the conclusion template remains the same—compare p-value to α, make a decision, and interpret in context—but the parameter of interest shifts to the difference p₁ − p₂.
SECTION 9
Practice Problems
Question 1: CONCEPTUAL
- A. Accept H₀ because the p-value is small.
- B. Reject H₀ because the p-value is less than α, and conclude there is convincing evidence for Hₐ in context.
- C. Fail to reject H₀ because the p-value is greater than 0.01.
- D. Reject Hₐ because the test statistic falls in the rejection region.
- E. The test proves that the population proportion equals the value stated in Hₐ.
Show answer (B)
Question 2: BASIC CALCULATION
- A. Reject H₀. There is convincing evidence that the proportion of students who use the school bus is less than 0.60.
- B. Fail to reject H₀. There is not convincing evidence that the proportion of students who use the school bus differs from 0.60.
- C. Accept H₀. The proportion of students who use the school bus is 0.60.
- D. Reject H₀. The p-value of 0.063 is close enough to 0.05 to be considered significant.
- E. Fail to reject H₀. There is convincing evidence that the proportion of students who use the school bus is 0.60.
Show answer (B)
Question 3: INTERMEDIATE
- A. Reject H₀; a Type II error could have been made, meaning the group concludes the proportion is above 0.20 when it is actually below 0.20.
- B. Fail to reject H₀; a Type I error could have been made, meaning the group fails to detect a real increase above 0.20.
- C. Reject H₀; a Type I error could have been made, meaning the group concludes more than 20% of boxes are underweight when in fact exactly 20% (or fewer) are.
- D. Reject H₀; both Type I and Type II errors could have been made simultaneously.
- E. Fail to reject H₀; a Type II error could have been made, meaning the group missed a real increase in underweight boxes.
Show answer (C)
Question 4: APPLIED
5 ptsShow answer
Question 5: CRITICAL THINKING
6 ptsShow answer
SUMMARY
Summary
Summary
Concluding a one-proportion z-test requires two integrated components. First, you compare the p-value to the pre-set significance level α and make a formal decision: reject H₀ if p-value ≤ α, or fail to reject H₀ if p-value > α. Second, you interpret the decision in the real-world context of the problem, referencing the population, the parameter, and the direction of Hₐ. Never say 'accept H₀' and never say 'prove'—the correct phrasing is 'there is (or is not) convincing evidence that…' followed by the alternative claim stated in plain language.
Identifying the potential error type is the final critical skill: when you reject, the risk is a Type I error (false rejection of a true H₀), and when you fail to reject, the risk is a Type II error (failure to detect a real departure from H₀). Describing these errors in context—explaining what real-world consequence would follow—demonstrates the deepest level of statistical reasoning and is essential for full credit on the AP Statistics exam.