

SECTION 1
Historical Context & Motivation
Statistics as a discipline has always been driven by the need to make meaningful comparisons—between treatments and controls, between populations and samples, between one era and another. The ability to compare distributions of a quantitative variable lies at the heart of data analysis, because isolated descriptions of a single group rarely answer the questions that motivate data collection in the first place. Whether a public health researcher wants to know if a new medication lowers blood pressure more effectively than an existing one, or an economist asks whether income distributions differ across regions, the analytical challenge is the same: how do we move beyond describing one group to making rigorous, structured comparisons between two or more groups?
1786 • Playfair's Bar Charts
1900 • Pearson's Chi-Square & Formal Testing
1969 • Tukey's Stem-and-Leaf & Boxplot
1977 • Tukey's EDA Published
The fundamental question this topic addresses is deceptively simple: How do these groups differ, and how are they alike? Answering it well requires a systematic framework—one that considers shape, center, spread, and outliers in tandem, always in context. The AP Statistics curriculum places this skill early because every subsequent inferential procedure (two-sample t-tests, ANOVA, regression) builds on the ability to describe and compare distributions thoughtfully.
SECTION 2
Core Principles of Distribution Comparison
When comparing distributions of a quantitative variable across two or more groups, the AP Statistics framework asks you to address four key features in every comparison. These features form the mnemonic SOCS—Shape, Outliers (and other unusual features), Center, and Spread—and each must be discussed using comparative language rather than in isolated descriptions. Stating that "Group A is right-skewed" and "Group B is roughly symmetric" is good, but the comparative framing—"Group A is right-skewed while Group B is roughly symmetric"—is what earns full credit on the AP exam.
Shape
Outliers & Unusual Features
Center
Spread
KEY TAKEAWAY
AP Exam Tip
SECTION 3
Visual Explanation: Side-by-Side Comparison
The most effective way to compare distributions is through parallel graphical displays that share a common axis. When histograms, dotplots, or boxplots are placed side by side on the same scale, differences in shape, center, and spread become immediately visible. The following diagram illustrates side-by-side boxplots for test scores from two classes, allowing you to compare all four SOCS features at a glance.
Notice how placing both boxplots on the same scale (40 to 90) makes the comparison immediate. You can see at a glance that Class B's scores are generally higher (the entire box is shifted to the right), while Class A's scores are more spread out (the box and whiskers span a wider range). This kind of visual evidence is exactly what you should reference when writing a comparison on the AP exam. When reading boxplots, remember that the box represents the middle 50% of data (the IQR), the line inside the box marks the median, and the whiskers extend to the smallest and largest non-outlier values.
SECTION 4
Numerical Measures for Comparison
While graphical displays provide an intuitive comparison, numerical summary statistics allow you to make precise, quantitative statements about how distributions differ. The choice of which statistics to report depends on the shape of the distributions being compared. For roughly symmetric distributions without strong outliers, the mean and standard deviation are the preferred measures of center and spread. For skewed distributions or those with outliers, the median and interquartile range (IQR) are more robust choices because they resist the pull of extreme values.
SAMPLE MEAN
Where n is the sample size and xᵢ represents each observation. The mean is the arithmetic average—sensitive to every data value, including outliers.
SAMPLE STANDARD DEVIATION
The standard deviation measures the typical distance of observations from the mean. A larger s indicates more variability. Like the mean, it is sensitive to outliers.
INTERQUARTILE RANGE
Where Q₁ is the 25th percentile and Q₃ is the 75th percentile. The IQR captures the spread of the middle 50% of observations and is resistant to outliers.
OUTLIER IDENTIFICATION (1.5 × IQR RULE)
This criterion defines the "fences" beyond which observations are flagged as potential outliers. On boxplots, outliers appear as individual dots beyond the whiskers.
Matching Statistics to Shape
SECTION 5
Types of Comparative Displays
Several graphical displays are commonly used for comparing distributions, and each has its own strengths. The choice depends on the number of groups, the sample sizes, and the level of detail required. On the AP exam, you should be comfortable reading and interpreting all of the following display types, and you should be prepared to construct boxplots and dotplots by hand.
The back-to-back stemplot places two groups' leaves on opposite sides of a shared stem column, preserving every individual data value while facilitating direct comparison. It works best when you have exactly two groups with relatively small sample sizes. Parallel dotplots stack separate dotplots vertically on a shared horizontal axis, making it easy to see the overall shape and individual data points. Parallel boxplots are the most commonly used display for AP Statistics because they efficiently summarize and compare the five-number summary across any number of groups. However, remember that boxplots sacrifice detail—they do not reveal bimodality, clusters, or gaps within the middle 50% of the data.
SECTION 6
Worked Example: Comparing Two Groups
A researcher collected data on the number of hours of sleep per night for two groups: 12 college students during finals week and 12 college students during a regular (non-exam) week. The data are summarized below.
| Statistic | Finals Week | Regular Week |
|---|---|---|
| Minimum | 3.5 | 6.0 |
| Q₁ | 4.5 | 6.8 |
| Median | 5.5 | 7.5 |
| Q₃ | 6.2 | 8.0 |
| Maximum | 7.0 | 9.0 |
| Mean | 5.3 | 7.4 |
| Std. Dev. | 1.1 | 0.9 |
Five-number summaries and descriptive statistics for hours of sleep per night
Writing a Complete Comparison (SOCS)
- 1
Step 1 — Compare Shape
For the finals week group, the mean (5.3) is slightly less than the median (5.5), suggesting a slight left skew—some students may have gotten very little sleep. For the regular week group, the mean (7.4) and median (7.5) are nearly equal, suggesting a roughly symmetric distribution. Both distributions are approximately symmetric to slightly skewed.Both distributions are roughly symmetric; the finals week group may be slightly left-skewed. - 2
Step 2 — Note Outliers / Unusual Features
Using the 1.5 × IQR rule for the finals group: IQR = 6.2 − 4.5 = 1.7, so fences are at 4.5 − 1.5(1.7) = 1.95 and 6.2 + 1.5(1.7) = 8.75. The minimum (3.5) and maximum (7.0) both fall within these fences, so there are no outliers. For the regular week group: IQR = 8.0 − 6.8 = 1.2, fences at 6.8 − 1.8 = 5.0 and 8.0 + 1.8 = 9.8. Again, no outliers.Neither distribution appears to have outliers by the 1.5 × IQR criterion. - 3
Step 3 — Compare Center
The median sleep during finals week (5.5 hours) is substantially lower than the median sleep during a regular week (7.5 hours)—a difference of 2.0 hours. This indicates that college students typically get about 2 fewer hours of sleep per night during finals compared to a normal week.Center: Regular week median (7.5 hrs) is 2.0 hours higher than finals week median (5.5 hrs). - 4
Step 4 — Compare Spread
The IQR for the finals week group (1.7 hours) is greater than the IQR for the regular week group (1.2 hours), and the standard deviations tell the same story (1.1 vs. 0.9). The range of sleep hours during finals (3.5 hours) also exceeds that of a regular week (3.0 hours). This suggests that there is more variability in sleep during finals week—some students cut sleep dramatically while others maintain closer-to-normal patterns.Spread: Finals week (IQR = 1.7, s = 1.1) is more variable than regular week (IQR = 1.2, s = 0.9). - 5
Step 5 — Context & Conclusion
In the context of this study, college students during finals week get substantially less sleep and show more variability in sleep hours than students during a regular week. The distributions have similar shapes (both roughly symmetric) and neither contains outliers, but they differ meaningfully in center and spread.Complete comparison: Both distributions are roughly symmetric with no outliers, but finals-week sleep is centered about 2 hours lower and is more variable than regular-week sleep.
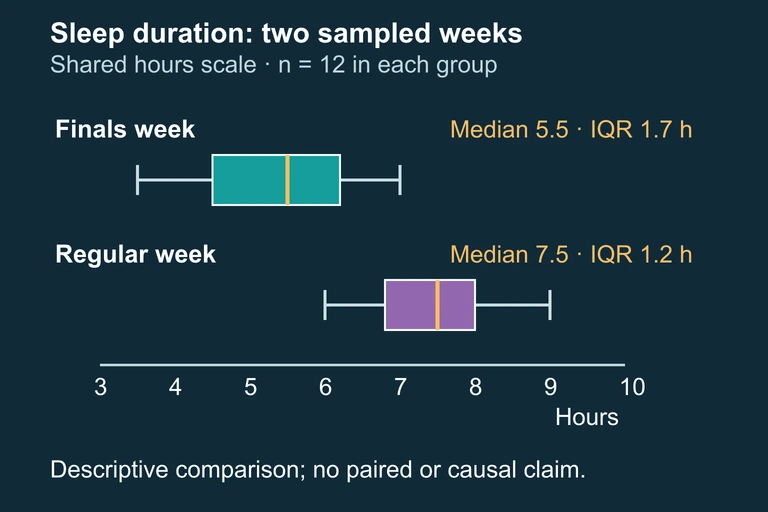 The sampled finals-week group has a lower median and a larger IQR than the regular-week group; summaries do not establish causation or full shape.
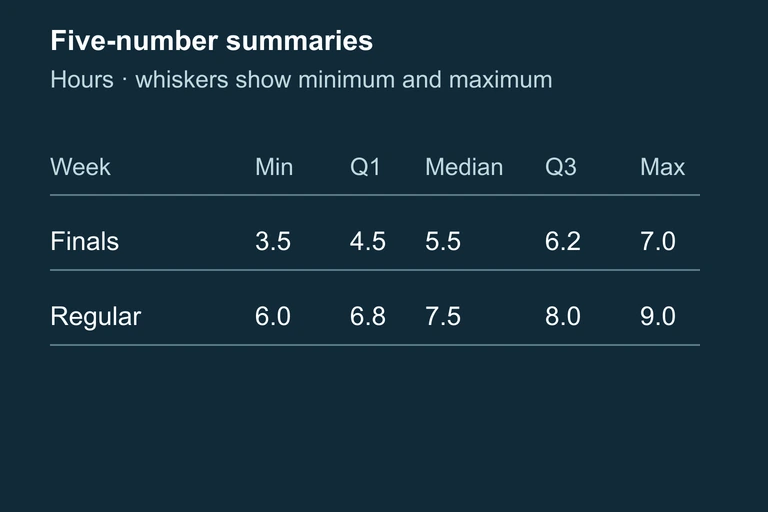 Table of both groups’ five-number summaries. Boxplot whiskers represent minimum and maximum values.
SECTION 7
Common Strengths & Pitfalls
Even students who understand the SOCS framework often lose points on AP free-response questions because of avoidable errors. The table below contrasts effective comparison strategies with common mistakes, drawn from released AP scoring guidelines.
| Effective Strategy ✓ | Common Pitfall ✗ |
|---|---|
| Use explicit comparative language: "Group A's median is higher than Group B's." | Describe each group in isolation without connecting them: "Group A's median is 72. Group B's median is 65." |
| Address all four SOCS features (shape, outliers, center, spread). | Mention only center, ignoring shape and/or spread. |
| Include specific numerical evidence: "The IQR for finals week (1.7 hrs) exceeds that of the regular week (1.2 hrs)." | Make vague claims: "One group is more spread out." |
| Use consistent statistics: if one distribution is skewed, report median and IQR for both. | Mix statistics: report the mean for one group and the median for the other. |
| Provide context: relate your comparison to the variable and groups being studied. | Write a generic comparison with no reference to the variables or real-world meaning. |
Scoring strategies vs. common errors on AP distribution comparison questions
THE COMPARISON PRINCIPLE
SECTION 8
Connection to Inference
Descriptive comparison of distributions is the essential first step, but it does not by itself establish whether observed differences are statistically significant. Later in the AP Statistics curriculum, you will encounter inferential methods—particularly the two-sample t-test and the two-sample t-interval—that allow you to determine whether a difference in means could plausibly be due to chance alone. Understanding how to compare distributions descriptively prepares you for those procedures in two critical ways: (1) checking conditions such as approximate normality or identifying outliers that might violate assumptions, and (2) developing intuition about whether a difference in centers is large relative to the spread within each group.
| Descriptive Comparison (Unit 1) | Inferential Comparison (Units 7–8) |
|---|---|
| Describes the observed data | Generalizes from sample data to populations |
| Uses graphs and summary statistics (SOCS) | Uses test statistics, p-values, and confidence intervals |
| Answers: "How do these samples differ?" | Answers: "Is the difference likely real, or due to chance?" |
| No assumptions about random sampling required | Requires random sampling/assignment and normality conditions |
| Checks shape and outliers to choose appropriate statistics | Checks shape and outliers to verify inference conditions |
Descriptive vs. inferential comparison of distributions
A useful heuristic: if the boxplots for two groups show substantial overlap (the boxes themselves are at similar positions on the axis), then a formal test may reveal no statistically significant difference. Conversely, if the boxes barely overlap or are entirely separated, there is strong visual evidence that the population centers differ. While this heuristic is not a substitute for a formal test, it builds the kind of statistical intuition that will serve you throughout the course and in professional data analysis.
SECTION 9
Practice Problems
Question 1: CONCEPTUAL
- A. The student needs to include a hypothesis test for the difference in medians.
- B. The student needs to describe shape and outliers, use comparative language, and provide context.
- C. The student needs to report the mean and standard deviation instead of the median and IQR.
- D. The student needs to include a calculation of the coefficient of variation for each group.
- E. The comparison is already complete; no additional information is needed.
Show answer (B)
Question 2: BASIC CALCULATION
- A. Group X has greater spread (IQR = 16) than Group Y (IQR = 10).
- B. Group Y has greater spread (IQR = 10) than Group X (IQR = 8).
- C. Both groups have the same spread because their medians are only 2 apart.
- D. Group Y has greater spread (IQR = 15) than Group X (IQR = 12).
- E. The spread cannot be compared without knowing the standard deviations.
Show answer (A)
Question 3: INTERMEDIATE
- A. Office A has a higher center and more spread than Office B.
- B. Office B has a higher center than Office A, while Office A has a larger IQR and an outlier at 65 minutes.
- C. Office A and Office B have similar distributions because their ranges are close (40 vs. 32 minutes).
- D. Office A is symmetric while Office B is right-skewed, and both have the same variability.
- E. Office B has a higher center and more spread than Office A, and Office A has an outlier.
Show answer (B)
Question 4: APPLIED
4 ptsShow answer
Question 5: CRITICAL THINKING
4 ptsShow answer
SUMMARY
Lesson Summary
Summary
Comparing distributions of a quantitative variable requires a systematic examination of four features, remembered by the acronym SOCS: Shape, Outliers, Center, and Spread. Every comparison must use explicit comparative language ("higher than," "more variable than," "whereas") rather than isolated descriptions of each group. Use side-by-side boxplots, parallel dotplots, or back-to-back stemplots on a shared axis for visual comparison, and support your observations with specific numerical evidence (medians, IQRs, means, standard deviations).
Choose your summary statistics to match the shape of the distributions: use median and IQR for skewed distributions and mean and standard deviation for symmetric distributions, and always use the same pair of statistics for both groups. Remember that this descriptive comparison lays the groundwork for later inferential procedures (two-sample t-tests and confidence intervals) that will let you determine whether observed differences are statistically significant.