

SECTION 1
Historical Context & Motivation
Virtually every real-world measurement is the result of combining several sources of variability. When an insurance company estimates total claims, it sums thousands of individual policyholder losses; when a manufacturer checks whether two parts will fit together, it examines the difference in their dimensions. The mathematics of combining random variables provides the rules that make such analyses tractable. Without these rules, extending probability theory beyond single-variable problems would be nearly impossible.
1718 • De Moivre's Doctrine of Chances
1812 • Laplace's Théorie Analytique
1900 • Pearson & Biometrics
1933 • Kolmogorov's Axioms
The central question these developments addressed is deceptively simple: if you know the mean and variance of two separate random variables, what can you say about the mean and variance of their sum or difference? The answer—codified in the rules we study in this lesson—turns out to be elegant, powerful, and occasionally counterintuitive, especially the fact that variances add even when you subtract random variables.
SECTION 2
Core Principles & Definitions
Before diving into formulas, it is essential to internalize several foundational ideas. These principles govern every calculation you will perform when combining random variables, and a clear grasp of them will prevent the most common AP exam errors.
Linearity of Expectation
Variance Addition Rule
Independence Requirement
Linear Transformations
Standard Deviation from Variance
SECTION 3
Visualizing Combined Distributions
The diagram below illustrates how two independent normal random variables combine. Variable X has mean 50 and standard deviation 4, while variable Y has mean 30 and standard deviation 3. Notice that the combined distribution X + Y is centered at 80 (the sum of the means) and is wider than either individual distribution because the variances add, giving a standard deviation of 5.
A critical observation from this diagram is that the combined distribution is always wider than either individual distribution. This holds true whether we compute X + Y or X − Y. In the subtraction case, the center would shift to 50 − 30 = 20, but the spread would remain σ = 5. The width of the combined distribution reflects the total uncertainty contributed by both variables, and uncertainty cannot cancel through subtraction of independent quantities.
SECTION 4
Mathematical Framework
The rules for combining random variables fall into two categories: linear transformations of a single variable (shifting and scaling) and linear combinations of two or more variables. Both sets of rules are testable on the AP exam, and fluency with the notation below is essential.
Linear Transformation: Y = a + bX
MEAN OF A LINEAR TRANSFORMATION
Adding a constant a shifts the center; multiplying by b scales the center.
VARIANCE OF A LINEAR TRANSFORMATION
The additive constant a has no effect on spread. The multiplier b is squared when applied to variance, so σ(a + bX) = |b| · σ_X.
Combining Two Independent Variables: X ± Y
MEAN OF A SUM OR DIFFERENCE
Means follow the operation sign. This rule holds whether or not X and Y are independent.
VARIANCE OF A SUM OR DIFFERENCE (INDEPENDENT)
Variances always add when X and Y are independent—the plus sign applies regardless of whether the variables are added or subtracted. This is the most commonly tested rule on the AP exam.
SECTION 5
Key Scenarios & Classifications
On the AP exam, combining random variables appears in several distinct forms. Recognizing which scenario is at play determines which formula to use. The diagram below classifies the most common situations and shows the relevant formulas for each.
The 2X vs. X₁ + X₂ Distinction
This is one of the most commonly tested distinctions on the AP exam. Suppose X has mean 10 and standard deviation 3. If you double the single variable, you get 2X, which has mean 20 and standard deviation 2 × 3 = 6 (variance = 4 × 9 = 36). But if X₁ and X₂ are two independent observations from the same distribution, then X₁ + X₂ has mean 20 but standard deviation √(9 + 9) = √18 ≈ 4.24 (variance = 18). The means are identical, but the variances differ because 2X amplifies a single source of randomness while X₁ + X₂ draws from two independent sources.
| Quantity | Mean | Variance | Std Dev |
|---|---|---|---|
| X | 10 | 9 | 3 |
| 2X (linear transformation) | 20 | 36 | 6 |
| X₁ + X₂ (independent copies) | 20 | 18 | ≈ 4.24 |
Comparison of 2X versus X₁ + X₂ when μ_X = 10 and σ_X = 3
 A production line can combine two independent measurements or scale one measurement. Those operations can share a mean while producing different variances.
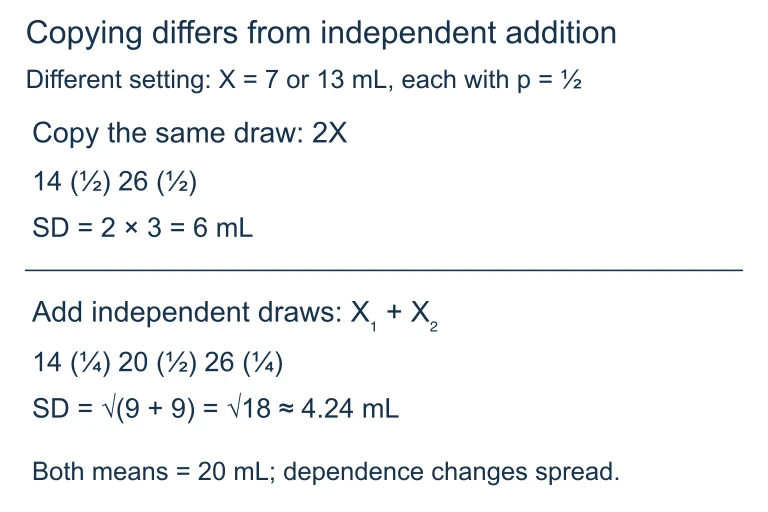 Suppose X is equally likely to be 7 or 13. Then 2X is 14 or 26 and has standard deviation 6. For independent X₁ and X₂, their sum is 14, 20 or 26 with probabilities 1/4, 1/2 and 1/4 and standard deviation √18. Both means are 20.
SECTION 6
Worked Example
A coffee shop sells lattes and pastries. Let L represent the profit on a randomly selected latte with μ_L = $2.50 and σ_L = $0.40, and let P represent the profit on a randomly selected pastry with μ_P = $1.80 and σ_P = $0.30. Assume L and P are independent. Find the mean and standard deviation of the total profit T = L + P on one latte-and-pastry combo, and the mean and standard deviation of the difference D = L − P.
Worked example
- 1
Step 1 — Identify Given Values
μ_L = 2.50, σ_L = 0.40, μ_P = 1.80, σ_P = 0.30. The variables L and P are independent. - 2
Step 2 — Find the Mean of the Sum
By linearity of expectation: μ_T = μ_L + μ_P = 2.50 + 1.80μ_T = $4.30 - 3
Step 3 — Find the Variance of the Sum
Since L and P are independent: σ²_T = σ²_L + σ²_P = (0.40)² + (0.30)² = 0.16 + 0.09σ²_T = 0.25 - 4
Step 4 — Find the Standard Deviation
σ_T = √0.25 = 0.50σ_T = $0.50
Worked example
- 1
Step 1 — Find the Mean of the Difference
μ_D = μ_L − μ_P = 2.50 − 1.80μ_D = $0.70 - 2
Step 2 — Find the Variance of the Difference
Even though we are subtracting, variances still add: σ²_D = σ²_L + σ²_P = 0.16 + 0.09σ²_D = 0.25 - 3
Step 3 — Standard Deviation of the Difference
σ_D = √0.25 = 0.50. Notice this is the same standard deviation as the sum—confirming that variance addition is unaffected by the sign of the combination.σ_D = $0.50
SECTION 7
Common Mistakes & Comparisons
Mastering the mechanics of combining random variables is only half the battle. On the AP exam, many points are lost to avoidable conceptual errors. The table below catalogues the most frequent mistakes alongside the correct reasoning.
| Common Mistake | Why It's Wrong | Correct Approach |
|---|---|---|
| Adding standard deviations: σ(X + Y) = σ_X + σ_Y | Standard deviations don't add linearly. Only variances add for independent variables. | σ(X + Y) = √(σ²_X + σ²_Y) |
| Subtracting variances: σ²(X − Y) = σ²_X − σ²_Y | Subtraction increases total uncertainty. Variance cannot be negative, and independent errors compound. | σ²(X − Y) = σ²_X + σ²_Y |
| Confusing 2X with X₁ + X₂ | 2X scales one observation; X₁ + X₂ sums two independent observations. They yield different variances. | Var(2X) = 4σ²_X; Var(X₁ + X₂) = 2σ²_X |
| Applying variance rule to dependent variables | The simple addition rule requires independence. Dependent variables introduce a covariance term. | Verify independence is stated or implied before using σ²_X + σ²_Y. |
| Forgetting to square the constant in transformations | Var(3X) = 9σ²_X, not 3σ²_X. The constant must be squared. | Var(bX) = b²·Var(X) |
Five most common errors when combining random variables
Key takeaway
SECTION 8
Connections to Advanced Topics
The rules for combining random variables serve as the mathematical backbone for several major topics you will encounter later in the AP Statistics course and in college-level probability and inference. Understanding these connections reveals why mastering the present topic is so important.
| This Lesson | Where It Leads |
|---|---|
| μ(X₁ + X₂ + … + Xₙ) = nμ | Leads directly to the expected value of the sampling distribution of the sample mean: E(X̄) = μ. |
| Var(X₁ + … + Xₙ) = nσ² | After dividing by n², gives Var(X̄) = σ²/n — the foundation of the Central Limit Theorem. |
| σ²(X − Y) = σ²_X + σ²_Y | Underpins the two-sample t-test for the difference of means and the standard error formula for p̂₁ − p̂₂. |
| Linear transformation rules | Used in standardizing variables to z-scores: Z = (X − μ)/σ is a linear transformation with a = −μ/σ, b = 1/σ. |
How combining-random-variable rules connect to later AP Statistics topics
Beyond AP Statistics, the general version of the variance-of-a-sum formula for dependent variables includes the covariance: Var(X + Y) = Var(X) + Var(Y) + 2Cov(X, Y). When X and Y are independent, Cov(X, Y) = 0, which collapses to the simpler rule studied here. In multivariate statistics and portfolio theory, the covariance matrix generalizes these ideas to arbitrarily many correlated variables, enabling analysts to quantify risk in financial portfolios and measurement systems. The independence assumption you are learning now is thus a special—but extremely common and practically useful—case of a much broader framework.
SECTION 9
Practice Problems
Question 1: CONCEPTUAL
- A. σ(X − Y) = σ_X − σ_Y
- B. σ(X − Y) = σ_X + σ_Y
- C. σ(X − Y) = √(σ²_X + σ²_Y)
- D. σ(X − Y) = √(σ²_X − σ²_Y)
- E. σ(X − Y) = σ²_X + σ²_Y
Show answer (C)
Question 2: BASIC CALCULATION
- A. μ_Y = 43, σ_Y = 22
- B. μ_Y = 43, σ_Y = 15
- C. μ_Y = 43, σ_Y = 75
- D. μ_Y = 36, σ_Y = 15
- E. μ_Y = 43, σ_Y = 225
Show answer (B)
Question 3: INTERMEDIATE
- A. Var(2X₁) = Var(X₁ + X₂) = 72
- B. Var(2X₁) = 144; Var(X₁ + X₂) = 72
- C. Var(2X₁) = 72; Var(X₁ + X₂) = 144
- D. Var(2X₁) = Var(X₁ + X₂) = 144
- E. Var(2X₁) = 144; Var(X₁ + X₂) = 36
Show answer (B)
Question 4: APPLIED
Show answer
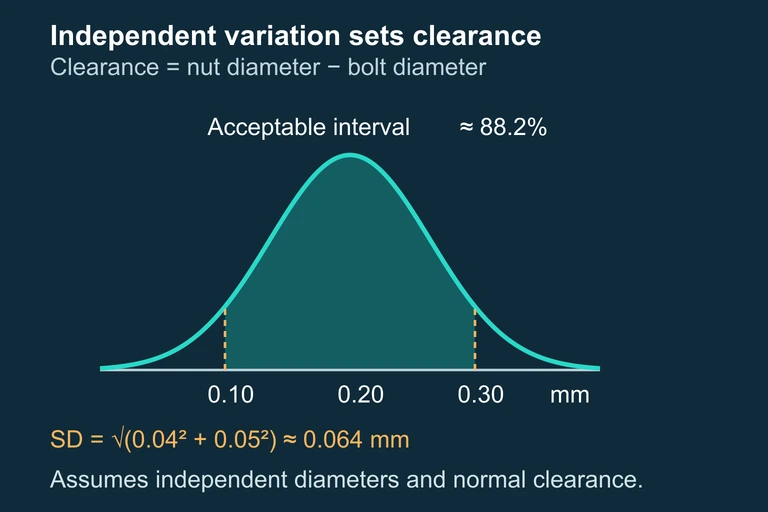 Independent nut and bolt variation combine through added variances for their clearance, under the stated distribution assumptions.
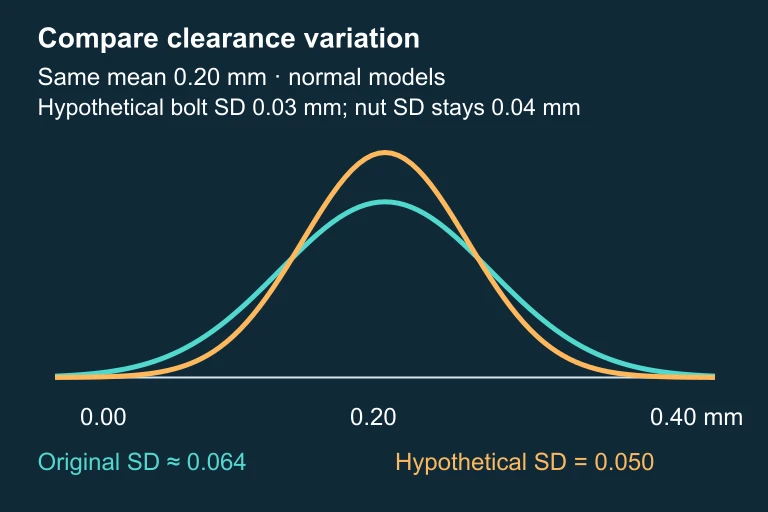 Two normal clearance models centered at 0.20 mm, with standard deviations about 0.064 and 0.050 mm. The narrower model has a taller density and more probability in the acceptance interval.
Question 5: CRITICAL THINKING