

SECTION 1
Historical Context & Motivation
Long before the formal apparatus of hypothesis testing existed, researchers confronted a deceptively simple question: when observed counts in a table of categorical data deviate from what we would expect under some null model, how do we decide whether those deviations are large enough to matter? The answer required a test statistic whose sampling distribution was known, and the development of that statistic — the chi-square (χ²) statistic — reshaped how scientists analyze categorical data. Understanding the historical trajectory of this tool illuminates why the setup of a chi-square test matters just as much as the computation itself.
1900 • Pearson's Chi-Square Test
1922 • Fisher's Refinement
1930s • Homogeneity vs. Independence
1950s–70s • Textbook Codification
Despite the shared computation, the test for homogeneity and the test for independence begin with fundamentally different research designs and hypotheses. The AP Statistics exam rewards students who can clearly articulate which test applies to a given scenario, state the correct hypotheses, verify the conditions, and interpret results in context. This lesson addresses the critical question: how do you set up each test correctly before any arithmetic begins?
SECTION 2
Core Principles & Definitions
Before you can set up a chi-square test correctly, you need a firm grasp of several interrelated concepts. Both the test for homogeneity and the test for independence analyze data organized in a two-way table (also called a contingency table), where one categorical variable defines the rows and another defines the columns. The cells contain observed counts — not percentages or proportions. The distinction between the two tests lies entirely in how the data were collected and what the null hypothesis claims.
Test for Homogeneity
Test for Independence
Expected Counts
Degrees of Freedom
Conditions for Inference
KEY TAKEAWAY
SECTION 3
Visual Explanation: Study Design Decision Flowchart
One of the most common exam pitfalls is misidentifying which chi-square test to use. The following flowchart walks you through the decision process based entirely on how the data were collected. Start at the top and follow the arrows to determine the correct test setup.
Notice that the flowchart converges at the bottom: both tests use the same χ² formula and the same degrees of freedom. The only differences are (1) the research design, (2) the wording of the hypotheses, and (3) which totals in the two-way table are predetermined by the design. On the AP exam, identifying these distinctions in context is worth significant credit in free-response scoring.
 The way people or groups enter a study determines its design. Sampling within groups, selecting whole groups and assigning treatments answer different questions.
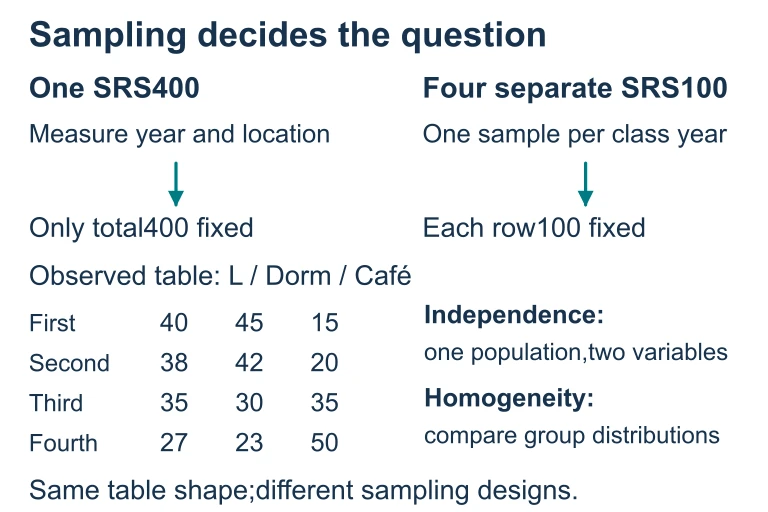 For the displayed 400-student table, expected counts in each row are 35, 35 and 30, and df = (4 − 1)(3 − 1) = 6. One random sample classified twice tests independence; separately sampled class-year groups test homogeneity.
SECTION 4
Mathematical Framework
Setting up the chi-square test requires computing expected counts under the null hypothesis and then measuring how far the observed data depart from those expectations. The mathematical machinery is compact but conceptually powerful: every cell in the two-way table contributes a term to the test statistic, and the sum of those terms follows a known distribution (under certain conditions) that lets us compute a p-value.
EXPECTED COUNT
For each cell in the two-way table, E represents the count we would expect if the null hypothesis were true. This formula works identically for both the homogeneity and independence tests.
CHI-SQUARE TEST STATISTIC
O = observed count in a cell, E = expected count in that cell. The sum is taken over all cells in the table. Large values of χ² provide evidence against H₀.
DEGREES OF FREEDOM
r = number of rows, c = number of columns. The degrees of freedom determine the shape of the χ² distribution used to find the p-value. For a 3 × 4 table, df = (3 − 1)(4 − 1) = 6.
Stating the Hypotheses
Although the computation is identical, the hypotheses must match the study design. For a test for homogeneity: H₀ states that the distribution of the categorical response variable is the same for all populations (or treatment groups); Hₐ states that at least one population's distribution differs. For a test for independence: H₀ states that the two categorical variables are independent in the population; Hₐ states that the two variables are not independent (i.e., they are associated). On the AP exam, you must state these hypotheses in the context of the given problem, not just symbolically.
Exam Tip
SECTION 5
Checking the Conditions for Inference
Before computing the χ² statistic, you must verify three conditions. On the AP exam, failing to check conditions — or checking them incorrectly — is a common source of lost points on free-response questions. The conditions are the same for both the homogeneity and independence tests, though the way you describe the randomness condition differs slightly based on the study design.
A critical detail that many students overlook: the Large Counts condition applies to expected counts, not observed counts. If even one expected count falls below 5, the χ² approximation to the true sampling distribution becomes unreliable, and the test should not be performed in its standard form. In practice, this means you must compute (or at least spot-check) expected counts before running the test — which is why setting up the test carefully is so important.
Common Mistake
SECTION 6
Worked Example: Setting Up a Chi-Square Test
A university's admissions office surveyed a random sample of 400 current students and recorded each student's class year (Freshman, Sophomore, Junior, Senior) and preferred study location (Library, Dorm Room, Coffee Shop). The admissions office wants to know whether preferred study location is associated with class year. Here is the observed data:
| Library | Dorm Room | Coffee Shop | Row Total | |
|---|---|---|---|---|
| Freshman | 40 | 45 | 15 | 100 |
| Sophomore | 38 | 42 | 20 | 100 |
| Junior | 35 | 30 | 35 | 100 |
| Senior | 27 | 23 | 50 | 100 |
| Col Total | 140 | 140 | 120 | 400 |
Observed counts: Study location by class year (n = 400)
Setting Up the Chi-Square Test
- 1
Step 1 — Identify the Correct Test
A single random sample of 400 students was drawn from one population (current students at this university), and each student was classified on two categorical variables: class year and preferred study location. Because there is one sample and two categorical variables, this is a chi-square test for independence.Test for Independence - 2
Step 2 — State the Hypotheses
H₀: Class year and preferred study location are independent among students at this university. Hₐ: Class year and preferred study location are not independent (they are associated) among students at this university. Note that the hypotheses are stated in the context of the problem, not just as abstract symbols.H₀: independence; Hₐ: association - 3
Step 3 — Check the Random Condition
The problem states that the 400 students were a random sample of current students at this university. This satisfies the Random condition.✓ Random sample stated - 4
Step 4 — Check the 10% / Independence Condition
Since sampling was done without replacement, we need 400 ≤ 10% of all current students at this university. It is reasonable to assume the university has at least 4,000 students, so the 10% condition is satisfied and individual observations can be treated as independent.✓ 400 ≤ 10% of population - 5
Step 5 — Compute Expected Counts and Check Large Counts Condition
Expected count for each cell = (row total × column total) / 400. For Freshman–Library: (100 × 140) / 400 = 35. For Freshman–Dorm: (100 × 140) / 400 = 35. For Freshman–Coffee Shop: (100 × 120) / 400 = 30. Since all row totals are 100 and column totals are 140, 140, and 120, the expected counts for every row are 35, 35, and 30 respectively. All twelve expected counts are well above 5, so the Large Counts condition is satisfied.✓ All expected counts ≥ 5 (minimum is 30) - 6
Step 6 — State the Degrees of Freedom and Test Setup
The table has r = 4 rows and c = 3 columns, so df = (4 − 1)(3 − 1) = 3 × 2 = 6. We will use a χ² distribution with 6 degrees of freedom to compute the p-value. The test statistic is χ² = Σ (O − E)² / E, summed over all 12 cells. The test is now fully set up; computation of the test statistic and p-value would follow.df = 6; χ² distribution with 6 df
SECTION 7
Comparing Homogeneity, Independence, and Goodness-of-Fit
Students often confuse the three chi-square tests because they all involve categorical data and similar-looking formulas. The table below organizes the key differences along the dimensions that matter most for setting up each test: the study design, the hypotheses, the type of table, and the degrees of freedom formula.
| Feature | Goodness-of-Fit | Homogeneity | Independence |
|---|---|---|---|
| # of variables | 1 categorical variable | 1 categorical variable across ≥ 2 populations | 2 categorical variables in 1 population |
| # of samples | 1 sample | ≥ 2 independent samples | 1 sample |
| Table type | One-way (1 × c) | Two-way (r × c) | Two-way (r × c) |
| H₀ | Distribution matches a specified model | Distribution is the same across all populations | The two variables are independent |
| Degrees of freedom | k − 1 (k = # categories) | (r − 1)(c − 1) | (r − 1)(c − 1) |
| Expected counts | np₀ for each category | (row total × col total) / n | (row total × col total) / n |
Comparison of the three chi-square tests in AP Statistics
KEY TAKEAWAY
SECTION 8
Connections to Advanced Theory
The chi-square tests you learn in AP Statistics are special cases of a broader inferential framework. Understanding where these tests sit in the larger landscape of statistics helps you appreciate both their power and their limitations, and it previews material you will encounter in college-level courses.
| AP Statistics Level | Advanced / College Level |
|---|---|
| χ² test statistic: Σ (O − E)² / E | Derived as −2 × log-likelihood ratio (G-test), which is asymptotically equivalent to Pearson's χ² |
| Large counts condition: all E ≥ 5 | When expected counts are small, Fisher's exact test or permutation-based methods provide exact p-values |
| Reject or fail to reject H₀ | Standardized residuals (O − E) / √E identify which cells contribute most to the χ² statistic — a form of post-hoc analysis |
| Two-way tables only | Log-linear models extend χ² analysis to multi-way contingency tables with three or more categorical variables |
| No effect-size measure required | Cramér's V and the contingency coefficient quantify the strength of association, supplementing the significance test |
AP-level chi-square concepts and their advanced extensions
For the AP exam, you do not need to know Fisher's exact test, log-linear models, or Cramér's V. However, understanding that the chi-square test is an approximation that improves with larger expected counts deepens your understanding of why the conditions matter. The requirement that all expected counts be at least 5 is a practical threshold below which the χ² distribution becomes a poor model for the true sampling distribution of the test statistic. In more advanced courses, you will learn exact and simulation-based alternatives that remove this restriction.
SECTION 9
Practice Problems
Question 1: CONCEPTUAL
- A. Chi-square goodness-of-fit test
- B. Chi-square test for independence
- C. Chi-square test for homogeneity
- D. Two-sample z-test for proportions
- E. Matched-pairs t-test
Show answer (C)
Question 2: BASIC CALCULATION
- A. E = 50; df = 6
- B. E = 50; df = 11
- C. E = 75; df = 6
- D. E = 50; df = 12
- E. E = 75; df = 11
Show answer (A)
Question 3: INTERMEDIATE
- A. 20.4
- B. 24.0
- C. 10,200
- D. 41.7
- E. 17.0
Show answer (A)
Question 4: APPLIED
5 ptsShow answer
Question 5: CRITICAL THINKING
5 ptsShow answer
SUMMARY
Summary
Summary
Setting up a chi-square test correctly is the most conceptually demanding part of the procedure. The test for homogeneity applies when independent random samples are drawn from two or more populations (or subjects are randomly assigned to treatment groups), and the goal is to determine whether the distribution of a single categorical variable is the same across all populations. The test for independence applies when a single random sample is drawn from one population and each individual is classified on two categorical variables, with the goal of assessing whether those variables are associated.
Both tests use the same χ² = Σ (O − E)² / E test statistic, compute expected counts as (row total × column total) / grand total, and use df = (r − 1)(c − 1). Before computing, you must verify three conditions: the data were collected via random sampling or random assignment, the observations are independent (10% condition if sampling without replacement), and all expected counts are at least 5. On the AP exam, clearly identifying the test, stating hypotheses in context, and verifying conditions earn the majority of setup points.