

SECTION 1
Historical Context & Motivation
Statistical inference about categorical data poses a fundamentally different challenge than inference about means or proportions. When a researcher observes counts spread across multiple categories—such as the number of customers choosing each of six flavors—the question is not whether a single parameter equals some value, but whether an entire distribution of proportions matches a theoretical model. The tool built precisely for this purpose is the chi-square goodness of fit test, and understanding how to set it up correctly is the critical first step in applying it.
1900 • Pearson's Chi-Square Statistic
1922 • Fisher's Refinement
1952 • Cochran's Sample-Size Guidelines
2000s • Modern AP Statistics Curriculum
The central question the goodness of fit test addresses is deceptively simple: Do the observed counts in a set of categories differ significantly from what a hypothesized distribution predicts? Before any calculation takes place, the test must be set up with precise hypotheses, verified conditions, and a clear identification of the appropriate distribution. Getting the setup wrong can invalidate everything that follows, which is why the AP exam devotes considerable attention to this preliminary phase.
SECTION 2
Core Principles & Definitions
Setting up a chi-square goodness of fit test requires mastery of several interconnected ideas. The test applies to a single categorical variable whose outcomes fall into k mutually exclusive categories. The null hypothesis specifies an exact set of proportions for those categories, and the alternative hypothesis asserts that at least one proportion deviates from its hypothesized value. The following grid outlines the foundational concepts you need before writing a single symbol.
Observed Counts (O)
Expected Counts (E)
Null Hypothesis (H₀)
Alternative Hypothesis (Hₐ)
Conditions for Inference
KEY TAKEAWAY
SECTION 3
Visual Explanation: The Setup Flowchart
The flowchart captures the entire setup process that should appear in the State and Plan stages of the AP Statistics four-step inference process. In the State step, you write both hypotheses and define the parameter in context—the distribution of a categorical variable in the population. In the Plan step, you name the procedure, verify the three conditions, and note the degrees of freedom. Only after these steps are complete do you proceed to calculate the test statistic and draw a conclusion.
SECTION 4
Mathematical Framework
Although the focus of this lesson is the setup, understanding the formula you are setting up to use clarifies why each piece of the setup matters. The chi-square test statistic quantifies the overall discrepancy between observed and expected counts, and its sampling distribution under H₀ is approximately chi-square with k − 1 degrees of freedom—provided the conditions are met.
CHI-SQUARE TEST STATISTIC
Where Oᵢ = observed count for category i, Eᵢ = expected count for category i = n × pi, and the sum is taken over all k categories.
EXPECTED COUNT FORMULA
Where n = total sample size and pᵢ = the proportion specified for category i in H₀. Computing expected counts is part of the setup because you must verify the Large Counts condition before proceeding.
DEGREES OF FREEDOM
Where k = the number of categories. One degree of freedom is lost because the proportions must sum to 1, so the last proportion is determined once the others are known.
Why Expected Counts ≥ 5?
SECTION 5
Writing Hypotheses & Checking Conditions in Detail
The most common errors students make on the AP exam involve the hypotheses and conditions. This section breaks down every component so that your setup earns full credit. When writing hypotheses, you must define the parameter in the context of the problem. A generic statement like "the data fit the model" is not sufficient; you need to state what the categorical variable represents and specify every proportion.
Common Pitfalls in the Setup
- Omitting proportions from H₀ — Writing "H₀: the distribution is uniform" without specifying each pᵢ = 1/k will cost you credit. Always list the numerical values.
- Using proportions instead of counts for the Large Counts check — The condition is about expected counts (E ≥ 5), not expected proportions. Compute E = n × p for each category.
- Stating Hₐ as directional — The chi-square test is inherently one-sided (right-tail only), but Hₐ should state "at least one proportion differs," not specify which one is larger or smaller.
- Confusing observed and expected counts — The Large Counts condition requires expected counts ≥ 5, not observed counts. Even if an observed count is 2, the test may still be valid if the expected count is ≥ 5.
SECTION 6
Worked Example: Setting Up a Goodness of Fit Test
A candy company claims that its mixed bag contains 30% red, 20% orange, 20% yellow, 15% green, and 15% blue candies. A statistics student purchases a bag, selects a simple random sample of 150 candies, and records the following observed counts: 56 red, 24 orange, 28 yellow, 20 green, and 22 blue. The student wants to test whether the company's claimed distribution is accurate at the α = 0.05 significance level.
Setting Up the Chi-Square Goodness of Fit Test
- 1
Step 1 — Define the Parameter
Let the parameter be the true distribution of candy colors in the company's mixed bags. We are examining a single categorical variable (color) with five categories. - 2
Step 2 — State the Hypotheses
H₀: The distribution of candy colors is pred = 0.30, porange = 0.20, pyellow = 0.20, pgreen = 0.15, pblue = 0.15. Hₐ: At least one of the proportions of candy colors differs from its stated value.Hypotheses stated with all five proportions summing to 1.00. - 3
Step 3 — Name the Test and Significance Level
We will perform a chi-square goodness of fit test at α = 0.05. The degrees of freedom are df = k − 1 = 5 − 1 = 4.df = 4, α = 0.05 - 4
Step 4 — Check the Random Condition
The stated simple random sample is drawn within one purchased bag. This supports randomness within that bag, not an SRS across company production. Company-wide inference needs a sampling design that represents the company population.Within-bag randomness is stated; company-wide representativeness is not established. - 5
Step 5 — Check the Independence Condition
For sampling without replacement from the bag, check 150 ≤ 10% of the number of candies in that bag, which requires at least 1,500 candies. Company production size is not the relevant frame for this sample. The bag size is not given, and an appropriate independence or multinomial model must be justified before using the usual chi-square reference distribution.Independence requires additional information about the bag and sampling process. - 6
Step 6 — Check the Large Counts Condition
Compute expected counts under H₀: Ered = 150 × 0.30 = 45, Eorange = 150 × 0.20 = 30, Eyellow = 150 × 0.20 = 30, Egreen = 150 × 0.15 = 22.5, Eblue = 150 × 0.15 = 22.5. All expected counts are at least 5, so the Large Counts condition is satisfied.✔ All expected counts ≥ 5 (smallest is 22.5). - 7
Step 7 — Summary of Setup
The expected-count condition holds, with expected counts 45, 30, 30, 22.5 and 22.5. The hypotheses and df = 4 are specified, but the random-sampling and independence limitations above remain. A chi-square calculation could be performed conditionally on justified assumptions; these data alone do not establish a valid company-wide test.Setup identifies the model and its unresolved sampling assumptions.
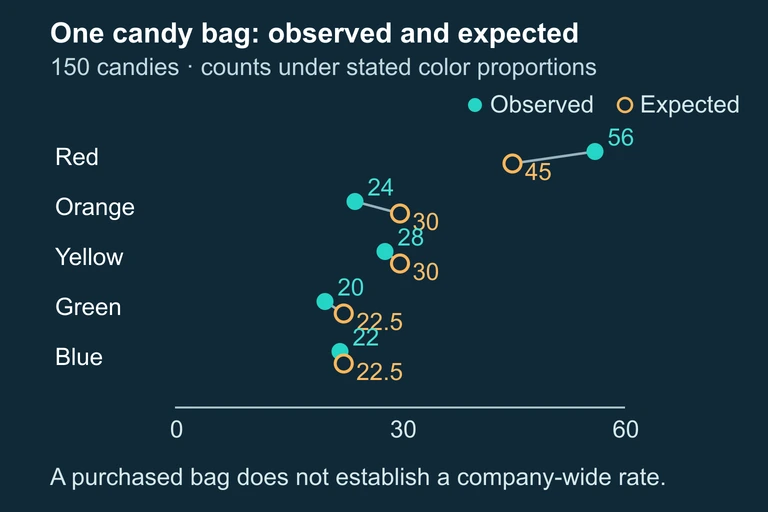 Observed color counts from one purchased bag can be compared with the stated model, but this design does not establish company-wide inference.
The five-category, 150-candy setup; company-wide inference is not established by one bag.
SECTION 7
Strengths & Limitations of the Goodness of Fit Test
The chi-square goodness of fit test is one of the most versatile tools in the categorical inference toolkit, but it has important limitations that shape how you set it up and interpret its results. The table below contrasts its key strengths against scenarios where caution is required.
| Strengths | Limitations |
|---|---|
| Works with any number of categories (k ≥ 2), making it flexible for nominal and ordinal data alike. | Requires all expected counts to be at least 5; when categories have small expected counts, you may need to combine categories or use an exact test. |
| The null hypothesis can specify any distribution—uniform, historical, theoretical—not just equal proportions. | The test is omnibus: a significant result tells you the distribution differs from H₀ but does not identify which specific categories deviate. |
| Computation is straightforward and supported by all major calculators and software packages. | The test uses counts, not proportions. Entering proportions or percentages into the formula produces incorrect results. |
| Minimal distributional assumptions—no requirement of normality for the underlying variable. | Independence is assumed; repeated measures or clustered data violate this condition and require alternative methods. |
Strengths and limitations of the chi-square goodness of fit test
KEY TAKEAWAY
SECTION 8
Connections to Other Chi-Square Tests
The goodness of fit test is one of three chi-square procedures in the AP Statistics curriculum. Understanding how it relates to the chi-square test for independence and the chi-square test for homogeneity clarifies when to use each and how the setup differs across the three tests.
| Feature | Goodness of Fit | Test for Independence / Homogeneity |
|---|---|---|
| Number of variables | One categorical variable | Two categorical variables (arranged in a two-way table) |
| Data layout | One-way frequency table (single row or column of counts) | Two-way contingency table (r rows × c columns) |
| H₀ statement | The population distribution matches specified proportions | The two variables are independent / the distributions are the same across populations |
| Expected counts | E = n × p (from hypothesized proportions) | E = (row total × column total) / grand total |
| Degrees of freedom | k − 1 | (r − 1)(c − 1) |
Comparison of chi-square procedures in AP Statistics
Notice that all three tests share the same test statistic formula, χ² = Σ (O − E)²/E, and the same Large Counts condition (all expected counts ≥ 5). The key difference lies in how expected counts are computed and how degrees of freedom are determined. In the goodness of fit test, the expected counts come directly from the hypothesized proportions multiplied by n, whereas in the two-way tests, they are derived from marginal totals. As you move through the AP curriculum, mastering the goodness of fit setup provides the template for the more complex two-variable setups.
SECTION 9
Practice Problems
Question 1: CONCEPTUAL
- A. Hₐ: ≠ 0.36, ≠ 0.28, p_AB ≠ 0.08, ≠ 0.28
- B. Hₐ: At least one of the proportions of blood types in the city differs from the national distribution.
- C. Hₐ: The distribution of blood types in the city is uniform.
- D. Hₐ: The mean blood type proportion is not equal to 0.25.
- E. Hₐ: > 0.36 or > 0.28 or p_AB > 0.08 or > 0.28
Show answer (B)
Question 2: BASIC CALCULATION
- A. Expected count = 50, df = 2
- B. Expected count = 50, df = 3
- C. Expected count = 25, df = 2
- D. Expected count = 0.25, df = 2
- E. Expected count = 50, df = 199
Show answer (A)
Question 3: INTERMEDIATE
- A. E₁ = 67.5, E₂ = 22.5, E₃ = 22.5, E₄ = 7.5; all expected counts ≥ 5, condition met.
- B. E₁ = 67.5, E₂ = 22.5, E₃ = 22.5, E₄ = 7.5; the condition fails because 7.5 is not a whole number.
- C. E₁ = 30, E₂ = 30, E₃ = 30, E₄ = 30; all expected counts ≥ 5, condition met.
- D. E₁ = 9, E₂ = 3, E₃ = 3, E₄ = 1; the condition fails because 1 < 5.
- E. E₁ = 67.5, E₂ = 22.5, E₃ = 22.5, E₄ = 7.5; the condition fails because we need observed counts ≥ 5.
Show answer (A)
Question 4: APPLIED
5 ptsShow answer
Question 5: CRITICAL THINKING
4 ptsShow answer
SUMMARY
Lesson Summary
Summary
Setting up a chi-square goodness of fit test begins with clearly stating the null hypothesis, which specifies a complete set of population proportions for each category of a single categorical variable, and the alternative hypothesis, which asserts that at least one proportion differs. Every proportion must be listed explicitly, and they must sum to 1. The parameter should be defined in the context of the problem.
Before computing anything, you must verify three conditions: the Random condition (data come from a random sample or random process), the Independence condition (sample size is less than 10% of the population), and the Large Counts condition (all expected counts E = n × p ≥ 5). Finally, identify the procedure as a chi-square goodness of fit test with df = k − 1 degrees of freedom. Mastering this setup ensures a solid foundation for the Do and Conclude steps that follow.