01 / 20

Sinusoidal Functions
Context & Data Modeling

Learn to model periodic real-world data using \( f(x) = a\sin(b(x - c)) + d \) and interpret every parameter in context.

AP Precalculus

What Is a Sinusoidal Function?

A sinusoidal function is any function that can be written in the form \( f(x) = a\sin(b(x - c)) + d \) or equivalently with cosine. It produces a smooth, repeating wave pattern that models periodic phenomena: anything that cycles at regular intervals.

Periodic
Repeats the same pattern over a fixed interval called the period.
Bounded
Output values oscillate between a maximum and minimum.
Smooth
Continuous and differentiable everywhere: no sharp corners.

Where Do We See Periodic Data?

Any quantity that rises and falls in a predictable cycle can be modeled with a sinusoidal function. The key requirement is that the pattern repeats at roughly equal time intervals.

Temperature
Average daily or monthly temperatures cycle annually with a period of 12 months.
Tides
Ocean levels rise and fall roughly every 12.4 hours.
Daylight
Hours of daylight cycle each year with a period of 365 days.

Anatomy of the General Form

x y d a max min
\( \text{Period} = \frac{2\pi}{b} \)
c

The Four Parameters in Detail

1
Amplitude \( |a| \): Half the distance between maximum and minimum. \( |a| = \frac{\text{max} - \text{min}}{2} \).
2
Period \( \frac{2\pi}{|b|} \): The horizontal length of one complete cycle. Solve \( |b| = \frac{2\pi}{\text{period}} \).
3
Phase shift \( c \): Horizontal translation. Positive \( c \) shifts right; negative shifts left.
4
Vertical shift \( d \): The midline of the wave. \( d = \frac{\text{max} + \text{min}}{2} \).

The General Sinusoidal Model

Use Sine
When data crosses the midline going up at \( x = c \).
Use Cosine
When data is at its maximum (or minimum) at \( x = c \).

Sine vs Cosine Starting Points

sin cos midline max

How to Model Data Step by Step

1
Find max and min from the data. Compute \( d = \frac{\text{max} + \text{min}}{2} \) and \( |a| = \frac{\text{max} - \text{min}}{2} \).
2
Determine the period. Identify the time for one full cycle. Then \( b = \frac{2\pi}{\text{period}} \).
3
Choose sine or cosine based on the starting behavior. Find the phase shift \( c \) so the model aligns with the data.
4
Determine the sign of \( a \). If the data starts by decreasing from the midline, use \( a < 0 \).
5
Write the equation and verify by plugging in known data points.

The harbor makes half a tide cycle visible

Two matched harbor views show the same fixed pier, pilings, shoreline buildings and blue boat at higher water and lower water; exposed rocks and piling lengths increase in the lower-water view.The harbor scene introduces periodic change; the accompanying graph models annual daylight. Annual daylight has midline 12.1 hours, amplitude 3.1 hours, and period 365 days. Its maximum occurs at day 172.

Daylight follows an annual model
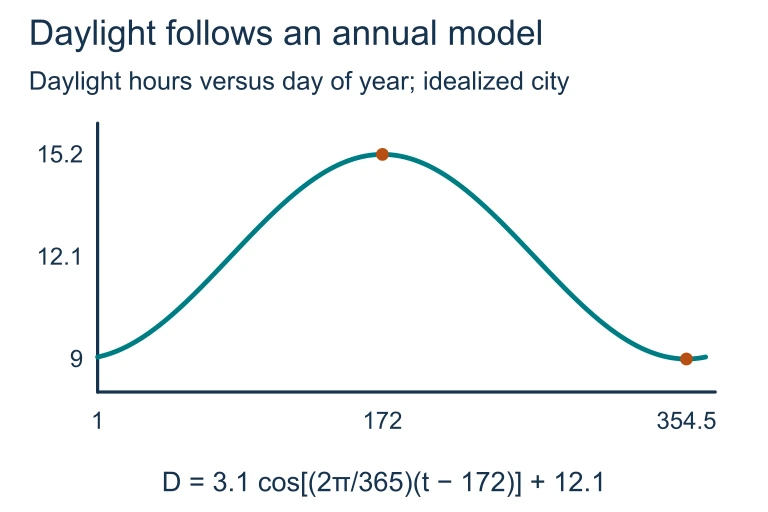
The harbor scene introduces periodic change; the accompanying graph models annual daylight. Annual daylight has midline 12.1 hours, amplitude 3.1 hours, and period 365 days. Its maximum occurs at day 172.The harbor scene introduces periodic change; the accompanying graph models annual daylight. Annual daylight has midline 12.1 hours, amplitude 3.1 hours, and period 365 days. Its maximum occurs at day 172.

Example 1: Monthly Temperature

A city's average monthly temperature ranges from a low of 30°F in January to a high of 82°F in July. Model the temperature \( T(t) \) where \( t \) is the month (January = 1).

30 56 82 °F d=56 J F M A M J J A S O N D 30° 82°

Example 2: Ocean Tides

High tide reaches 5.2 m at 2:00 AM. Low tide is 1.4 m at 8:15 AM. The cycle repeats every 12.5 hours. Write \( h(t) \) where \( t \) = hours after midnight.

1
\( d = \frac{5.2 + 1.4}{2} = \) 3.3 m (midline)
2
\( |a| = \frac{5.2 - 1.4}{2} = \) 1.9 m (amplitude)
3
\( b = \frac{2\pi}{12.5} = \) \( \frac{4\pi}{25} \)
4
Max at \( t = 2 \), so use cosine with \( c = 2 \).

Example 3: Ferris Wheel

A Ferris wheel has a diameter of 40 m, and its center is 25 m above the ground. It completes one revolution in 3 minutes. A rider boards at the bottom.

r = 20 m ground 25 m start a = 20 45 m 5 m h(t) t (min)

Read the wheel’s height model

A Ferris wheel rises above its boarding platform, showing the wheel’s center, circular rim and individual cabins.The wheel’s radius sets the amplitude of a rider’s height. The center’s height sets the midline, and boarding at the lowest point gives a negative cosine model.

Interpreting Parameters in Context

On the AP exam, you must explain what each parameter means in the real-world scenario, not just state its value.

\( |a| = 26 \)
"The temperature varies by 26°F above and below the average."
\( d = 56 \)
"The average annual temperature is 56°F."
\( b = \frac{\pi}{6} \)
"The cycle completes every 12 months."
\( c = 1 \)
"The cycle begins with the coldest month in January."

Modeling Imperfect Data

Real data rarely falls exactly on a sine curve. On the AP exam, data may be given as a table of values. You identify the sinusoidal pattern and build the best-fit model using the same four-parameter approach.

1
Estimate max and min from the data to find \( a \) and \( d \).
2
Estimate the period by finding the distance between two consecutive maxima (or minima).
3
Find \( c \) by identifying the \( x \)-value of the first max or the first midline crossing.
4
Verify by testing your equation at several data points. Small deviations are expected.

Common Mistakes to Avoid

Confusing Period with \( b \)
The period is \( \frac{2\pi}{|b|} \), not \( b \) itself. If data repeats every 12 months, \( b = \frac{\pi}{6} \), not 12.
Forgetting Negative \( a \)
If data starts at a minimum and you use cosine, you need \( a < 0 \). Without the negative, the curve is flipped.
Wrong Phase Shift Direction
\( \sin(b(x - c)) \) shifts right by \( c \). Students often shift left. Watch the sign inside the parentheses.

Parameter Summary Table

Parameter Formula Contextual Meaning
Amplitude \( |a| \) \( \frac{\text{max} - \text{min}}{2} \) How far values swing above/below average
Period \( \frac{2\pi}{|b|} \) Time for one complete cycle
Phase shift \( c \) Read from data alignment When the cycle starts
Midline \( d \) \( \frac{\text{max} + \text{min}}{2} \) Average (equilibrium) value
Maximum \( d + |a| \) Highest value in the cycle
Minimum \( d - |a| \) Lowest value in the cycle

Worked Example — Modeling Daylight Hours

A city in the Northern Hemisphere experiences a maximum of 15.2 hours of daylight on June 21 (day 172 of the year) and a minimum of 9.0 hours of daylight on December 21 (day 355). Write a sinusoidal function D(t) that models the number of hours of daylight as a function of the day of the year t, where t = 1 corresponds to January 1. Daylight Hours Model Step 1 — Compute the Midline d The midline is the average of the maximum and minimum daylight values: d = (15.2 + 9.0) / 2 = 24.2 / 2. d = 12.1 hours Step 2 — Compute the Amplitude |a| The amplitude is half the difference between the max and min: |a| = (15.2 − 9.0) / 2 = 6.2 / 2. |a| = 3.1 hours Step 3 — Determine the Period and b Daylight follows an annual cycle, so the period is T = 365 days. The frequency factor is b = 2π / T = 2π / 365. b = 2π/365 ≈ 0.01721 Step 4 — Determine the Phase Shift c (Using Cosine Form) Using the cosine form D(t) = a cos(b(t − c)) + d, the maximum occurs when the cosine equals 1 — that is, when t = c. The maximum daylight occurs on June 21, which is day 172. c = 172 Step 5 — Write and Verify the Model Substituting all parameters: D(t) = 3.1 cos((2π/365)(t − 172)) + 12.1. Verification: D(172) = 3.1 cos(0) + 12.1 = 3.1(1) + 12.1 = 15.2 ✓. Check the minimum: D(355) = 3.1 cos((2π/365)(355 − 172)) + 12.1 = 3.1 cos((2π/365)(183)) + 12.1 ≈ 3.1 cos(π) + 12.1 = 3.1(−1) + 12.1 = 9.0 ✓. D(t) = 3.1 cos((2π/365)(t − 172)) + 12.1 This example demonstrates the power of the cosine form: by aligning the phase shift with the known maximum, we avoid having to locate a midline crossing. The verification step is essential — always check that your model reproduces the known extremes. Note that 183 days is approximately half of 365, making (2π/365)(183) ≈ π, which confirms that the minimum is half a period away from the maximum, as expected for a symmetric sinusoidal curve.
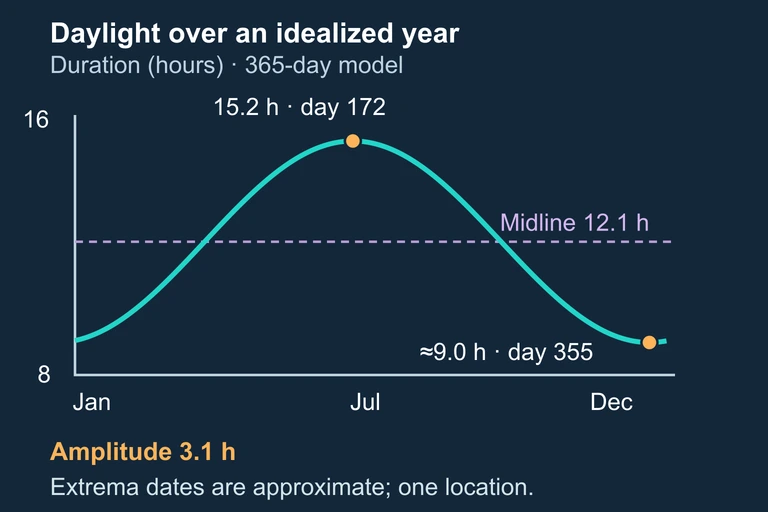
Annual daylight model with midpoint 12.1 hours, amplitude 3.1 hours, maximum 15.2 near day 172 and minimum near 9 hours around day 355.
The seasonal scenes share one location; exact duration bars show the approximate extrema of the stated 365-day daylight model.

Question 1 of 5

A city's average monthly temperature has a maximum of 90°F and a minimum of 40°F. What are the amplitude and midline of a sinusoidal model?

Question 2 of 5

A periodic process repeats every 8 hours. What is the value of \( b \) in \( f(t) = a\sin(b\,t) + d \)?

Question 3 of 5

A Ferris wheel has its lowest point at 3 m above ground and its highest point at 27 m. A rider starts at the bottom at \( t = 0 \). Which model is correct?

Question 4 of 5

For \( f(x) = 3\sin\!\left(2\!\left(x - \frac{\pi}{4}\right)\right) + 1 \), what is the range of \( f \)?

Question 5 of 5

Daylight hours in a city peak at 15 hours on June 21 (day 172) and reach a minimum of 9 hours on December 21 (day 355). The period is 365 days. In the model \( D(t) = a\cos\!\left(\frac{2\pi}{365}(t - c)\right) + d \), what is the phase shift \( c \)?