Rates of Change in
Polar Functions
Explore how polar curves change with respect to \(\theta\), and connect the derivative \(\frac{dr}{d\theta}\) to the geometry of spirals, roses, and cardioids.
What Is a Polar Function?
In Cartesian coordinates, we describe curves as \(y = f(x)\). In polar coordinates, we instead write \(r = f(\theta)\), where \(r\) is the distance from the origin and \(\theta\) is the angle from the positive \(x\)-axis.
Why Study Rates of Change?
In Cartesian calculus, \(\frac{dy}{dx}\) tells us how fast \(y\) changes relative to \(x\). For polar functions, \(\frac{dr}{d\theta}\) tells us how quickly the radius changes as the angle sweeps. This reveals whether the curve is spiraling outward, inward, or staying constant.
Average vs Instantaneous Rate
Just as in Cartesian analysis, we distinguish between the average rate of change over an interval and the instantaneous rate of change at a single point.
Measures the overall change in \(r\) across an interval of \(\theta\).
The exact rate at a single value of \(\theta\).
The Core Rule: Differentiating \(r = f(\theta)\)
Visualizing \(\frac{dr}{d\theta}\) on a Spiral
\(\frac{dr}{d\theta}\) vs \(\frac{dy}{dx}\): Know the Difference
These two derivatives answer different questions. Confusing them is one of the most common errors in polar analysis.
| \(\frac{dr}{d\theta}\) | \(\frac{dy}{dx}\) | |
|---|---|---|
| What it measures | How fast radius changes | Slope of the tangent line |
| Independent variable | \(\theta\) | \(x\) |
| Geometric meaning | Expanding/contracting | Rise over run in Cartesian |
| Formula in polar | \(f'(\theta)\) | \(\frac{f'(\theta)\sin\theta + f(\theta)\cos\theta}{f'(\theta)\cos\theta - f(\theta)\sin\theta}\) |
From Polar to Cartesian
Since \(x = r\cos\theta\) and \(y = r\sin\theta\), the Cartesian rates of change depend on both \(r\) and \(\frac{dr}{d\theta}\):
How to Apply: Step-by-Step
Example 1: Cardioid \(r = 1 + \cos\theta\)
Example 2: Rose Curve \(r = 3\sin(2\theta)\)
Example 3: Chain Rule with \(r = 2 + 3\cos(2\theta)\)
Problem: Find \(\frac{dr}{d\theta}\) at \(\theta = \frac{\pi}{6}\).
When \(\frac{dr}{d\theta} = 0\): Extrema of the Radius
Setting \(\frac{dr}{d\theta} = 0\) finds the angles where the radius is at a local maximum or minimum. These are the tips of petals, closest approach to the origin, or farthest reach of the curve.
Sign Analysis of \(\frac{dr}{d\theta}\)
Analyzing the sign of \(\frac{dr}{d\theta}\) across intervals tells us where the curve expands and where it contracts. This is analogous to the first derivative test in Cartesian calculus.
| Interval | \(\frac{dr}{d\theta}\) | Behavior of \(r\) |
|---|---|---|
| \((0, \pi)\) | \(-\sin\theta < 0\) | Decreasing |
| \((\pi, 2\pi)\) | \(-\sin\theta > 0\) | Increasing |
Common Mistakes
Quick Reference Table
| Polar Function | \(\frac{dr}{d\theta}\) | Key Feature |
|---|---|---|
| \(r = a\) | \(0\) | Circle: constant radius |
| \(r = a\theta\) | \(a\) | Spiral: constant rate |
| \(r = a\cos\theta\) | \(-a\sin\theta\) | Circle through origin |
| \(r = a(1+\cos\theta)\) | \(-a\sin\theta\) | Cardioid |
| \(r = a\sin(n\theta)\) | \(an\cos(n\theta)\) | Rose: \(n\)-petal structure |
| \(r = ae^{b\theta}\) | \(abe^{b\theta}\) | Log spiral: proportional growth |
Worked practice: Practice Problems — weather radar storm field
Work through this original lesson problem, then reveal the solution and illustrations.
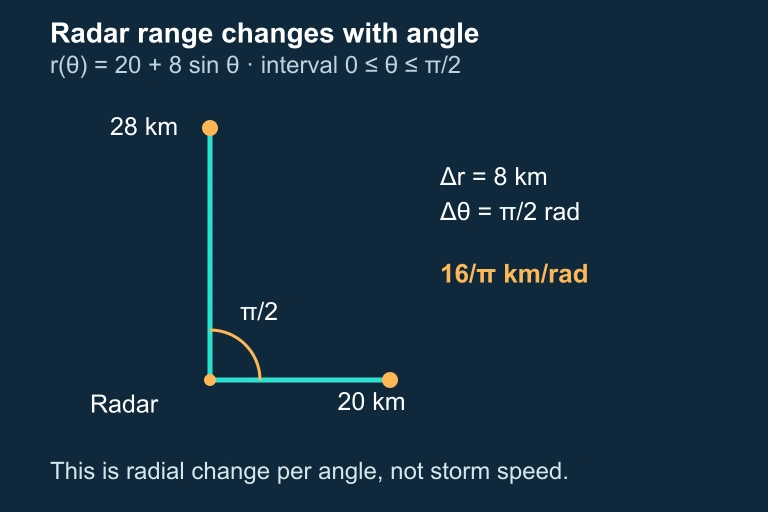
A weather radar station tracks a storm system. The boundary of the storm's precipitation field can be modeled by the polar function r(θ) = 20 + 8 sin θ, where r is measured in kilometers from the station and θ is the angle from due east, measured counterclockwise. (a) Compute the average rate of change of r with respect to θ over the interval [0, π/2]. Include units in your answer. (b) Compute the average rate of change of r over the interval [π/2, π]. (c) At what angle θ in [0, 2π] does the storm boundary reach its maximum distance from the station? Justify your answer using the behavior of the rate of change. (d) A meteorologist states that the storm is "roughly circular." Use the range of r values to evaluate this claim quantitatively.
Show answer and explanation
Point 1 (part a): r(0) = 20 + 8 sin(0) = 20 km and r(π/2) = 20 + 8 sin(π/2) = 28 km. Average rate = (28 − 20)/(π/2 − 0) = 8/(π/2) = 16/π ≈ 5.09 km per radian. The positive rate indicates the storm boundary extends farther from the station as the angle sweeps from east to north. Point 2 (part b): r(π/2) = 28 km and r(π) = 20 + 8 sin(π) = 20 km. Average rate = (20 − 28)/(π − π/2) = (−8)/(π/2) = −16/π ≈ −5.09 km per radian. The negative rate indicates the boundary is contracting back toward the station as the angle moves from north to west. Point 3 (part c): The maximum of r occurs at θ = π/2 because the rate of change transitions from positive (on [0, π/2]) to negative (on [π/2, π]). Since r = 20 + 8 sin θ and sin θ achieves its maximum value of 1 at θ = π/2, the maximum radial distance is r = 28 km. The sign change in the rate of change from positive to negative confirms this is a maximum. Point 4 (part d): The minimum r occurs at θ = 3π/2, where r = 20 + 8(−1) = 12 km. The maximum r is 28 km. The range of r values is 28 − 12 = 16 km, and the mean radius is (28 + 12)/2 = 20 km. The variation is ±8/20 = ±40% of the mean radius. This is a substantial deviation from circularity, so the claim that the storm is 'roughly circular' is not well supported — a true circle would have constant r with 0% variation.
Question 1 of 5
If \(r = 4\sin\theta\), what is \(\frac{dr}{d\theta}\) at \(\theta = \frac{\pi}{4}\)?
Question 2 of 5
For \(r = 2 + 2\cos\theta\), on which interval is the radius decreasing?
Question 3 of 5
What is the average rate of change of \(r = 3\cos\theta\) on \(\left[0, \frac{\pi}{2}\right]\)?
Question 4 of 5
For \(r = 5\sin(3\theta)\), what is \(\frac{dr}{d\theta}\)?
Question 5 of 5
For the cardioid \(r = 1 + \cos\theta\), \(\frac{dr}{d\theta} = 0\) at \(\theta = 0\) and \(\theta = \pi\). What does \(\frac{dr}{d\theta} = 0\) tell us about the curve at those points?