
SECTION 1
Historical Context & Motivation
The idea that repeating patterns in nature can be captured by mathematical functions stretches back millennia, rooted in the astronomical observations of ancient civilizations. Babylonian astronomers noticed that the length of daylight oscillated predictably over the course of a year, and Greek mathematicians formalized the study of chords in circles — the geometric ancestors of our modern sine and cosine functions. The decisive leap came when mathematicians recognized that these circular functions could serve as universal templates for any phenomenon that repeats at regular intervals — from ocean tides and sound waves to electrical currents and seasonal temperatures. This realization transformed trigonometry from a tool for surveying and navigation into the mathematical backbone of modern science and engineering.
~150 CE • Ptolemy's Chord Table
~500 CE • Indian Sine Function
1822 • Fourier's Breakthrough
1960s–Today • Digital Sinusoidal Modeling
The central question this lesson addresses is both practical and elegant: given a set of data that appears to rise and fall in a repeating cycle, how do we construct a sinusoidal function — complete with amplitude, period, phase shift, and vertical shift — that faithfully models the data and allows us to make predictions beyond the observed values? Answering this question requires fluency with the parameters of sine and cosine functions, a clear process for extracting those parameters from context or data, and an understanding of the assumptions and limitations embedded in the sinusoidal model.
SECTION 2
Core Principles & Definitions
A sinusoidal function is any function that can be written in the form f(x) = a sin(b(x − c)) + d or equivalently f(x) = a cos(b(x − c)) + d. These four parameters — amplitude, frequency factor, phase shift, and midline — completely determine the shape and position of the wave. In data-modeling contexts, identifying each parameter from a real-world scenario is the essential skill. The following grid defines these core parameters and explains how each one connects to observable features of periodic data.
Amplitude |a|
Period & Frequency Factor b
Phase Shift c
Midline d
Sine vs. Cosine Form
KEY TAKEAWAY
 The wheel’s radius sets the amplitude of a rider’s height. The center’s height sets the midline, and boarding at the lowest point gives a negative cosine model.
SECTION 3
Visual Explanation — Anatomy of a Sinusoidal Curve
Notice how the curve begins its upward crossing of the midline not at the y-axis but at a distance c to the right — this is the phase shift. The gold dot marks the maximum at y = d + a, and the red dot marks the minimum at y = d − a. In data modeling, you determine the midline first by averaging the observed maximum and minimum, then compute the amplitude, identify the period from the data's cycle length, and finally locate the phase shift by finding where in the input domain a key feature (such as a maximum or midline crossing) occurs. This visual decomposition is the roadmap you will follow in every sinusoidal modeling problem.
SECTION 4
Mathematical Framework
The general sinusoidal model can be expressed in two equivalent standard forms. Mastering the algebraic relationship between the parameters and the observable features of data is the central mathematical skill tested on the AP Precalculus exam. Below are the key equations, each accompanied by the contextual interpretation of its variables.
GENERAL SINUSOIDAL MODEL (SINE FORM)
where a = amplitude (vertical stretch), b = frequency factor (horizontal compression), c = phase shift (horizontal translation), d = midline (vertical translation).
MIDLINE FROM DATA
The midline is the average of the observed maximum and minimum output values. For temperature data where the high is 92°F and the low is 38°F, d = (92 + 38)/2 = 65°F.
AMPLITUDE FROM DATA
The amplitude is half the range of the data. Using the same temperature data, |a| = (92 − 38)/2 = 27°F. If a is negative, the curve is reflected over the midline.
PERIOD AND FREQUENCY FACTOR
Identify the period T from the data (e.g., T = 12 months for annual temperature cycles). Then compute b = 2π/T. For T = 12, b = 2π/12 = π/6.
Determining the phase shift c requires careful reasoning about context. If you choose the sine form, locate the input value where the function crosses the midline going upward — that input equals c. If you choose the cosine form, locate the input value where the function reaches its maximum — that input equals c. In practice, choosing cosine is often more convenient because maximum and minimum values are easier to identify in data tables than midline crossings. When a negative amplitude is used (reflecting the cosine), c aligns with the minimum instead.
AP Exam Tip
SECTION 5
Detailed Breakdown — From Data to Function
Translating raw periodic data into a sinusoidal model follows a systematic procedure. The diagram below illustrates the complete workflow: you begin with raw observations, identify the key features — maximum, minimum, and cycle length — extract the four parameters, write the function, and then validate it against additional data points. Understanding this pipeline is critical because AP Precalculus problems often present data in various forms: tables, graphs, or verbal descriptions. Regardless of the format, the extraction steps are the same.
The scatter plot in the lower portion of the diagram represents a classic AP Precalculus scenario: monthly average temperature data that rises to a summer peak and falls to a winter trough. The data's repeating annual cycle, roughly symmetric rise and fall, and bounded range all suggest that a sinusoidal model is appropriate. From the plot you can visually estimate the maximum (≈ 92°F in July, month 7), the minimum (≈ 34°F in January, month 1), and the period (12 months). These visual estimates become the inputs to the parameter extraction formulas presented in Section 4.
When Is a Sinusoidal Model Appropriate?
SECTION 6
Worked Example — Modeling Daylight Hours
A city in the Northern Hemisphere experiences a maximum of 15.2 hours of daylight on June 21 (day 172 of the year) and a minimum of 9.0 hours of daylight on December 21 (day 355). Write a sinusoidal function D(t) that models the number of hours of daylight as a function of the day of the year t, where t = 1 corresponds to January 1.
Daylight Hours Model
- 1
Step 1 — Compute the Midline d
The midline is the average of the maximum and minimum daylight values: d = (15.2 + 9.0) / 2 = 24.2 / 2.d = 12.1 hours - 2
Step 2 — Compute the Amplitude |a|
The amplitude is half the difference between the max and min: |a| = (15.2 − 9.0) / 2 = 6.2 / 2.|a| = 3.1 hours - 3
Step 3 — Determine the Period and b
Daylight follows an annual cycle, so the period is T = 365 days. The frequency factor is b = 2π / T = 2π / 365.b = 2π/365 ≈ 0.01721 - 4
Step 4 — Determine the Phase Shift c (Using Cosine Form)
Using the cosine form D(t) = a cos(b(t − c)) + d, the maximum occurs when the cosine equals 1 — that is, when t = c. The maximum daylight occurs on June 21, which is day 172.c = 172 - 5
Step 5 — Write and Verify the Model
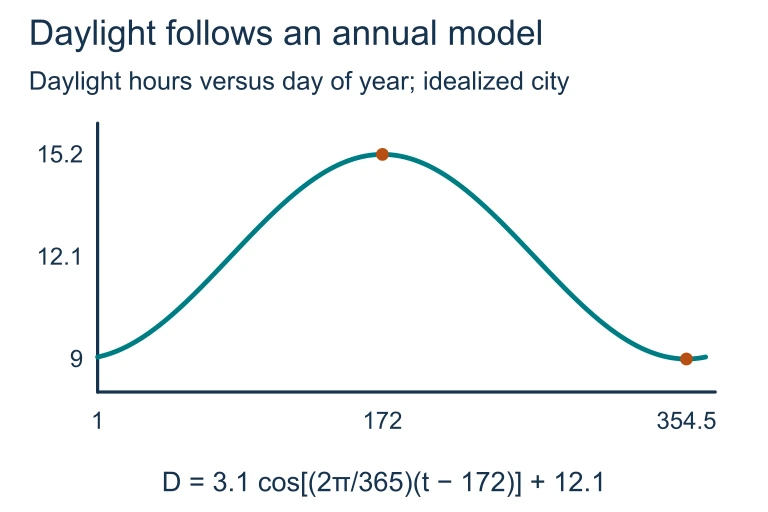
Substituting all parameters: D(t) = 3.1 cos((2π/365)(t − 172)) + 12.1. Verification: D(172) = 3.1 cos(0) + 12.1 = 3.1(1) + 12.1 = 15.2 ✓. Check the minimum: D(355) = 3.1 cos((2π/365)(355 − 172)) + 12.1 = 3.1 cos((2π/365)(183)) + 12.1 ≈ 3.1 cos(π) + 12.1 = 3.1(−1) + 12.1 = 9.0 ✓.D(t) = 3.1 cos((2π/365)(t − 172)) + 12.1
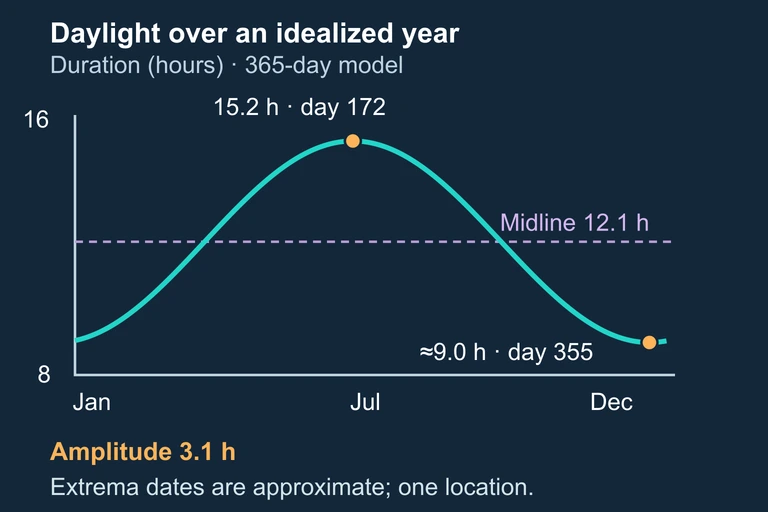 The seasonal scenes share one location; exact duration bars show the approximate extrema of the stated 365-day daylight model.
This example demonstrates the power of the cosine form: by aligning the phase shift with the known maximum, we avoid having to locate a midline crossing. The verification step is essential — always check that your model reproduces the known extremes. Note that 183 days is approximately half of 365, making (2π/365)(183) ≈ π, which confirms that the minimum is half a period away from the maximum, as expected for a symmetric sinusoidal curve.
 The harbor scene introduces periodic change; the accompanying graph models annual daylight. Annual daylight has midline 12.1 hours, amplitude 3.1 hours, and period 365 days. Its maximum occurs at day 172.
 The harbor scene introduces periodic change; the accompanying graph models annual daylight. Annual daylight has midline 12.1 hours, amplitude 3.1 hours, and period 365 days. Its maximum occurs at day 172.
SECTION 7
Strengths, Limitations & Model Assumptions
Every mathematical model carries assumptions, and the sinusoidal model is no exception. Understanding both its strengths and its limitations helps you assess when a sinusoidal function is the best choice and when an alternative model — such as a piecewise function, exponential decay, or Fourier series — might be more appropriate. The table below summarizes the key tradeoffs.
| Feature | Strength | Limitation |
|---|---|---|
| Periodicity | Perfectly captures repeating cycles of constant length. | Cannot model phenomena whose cycle length changes over time (e.g., accelerating heartbeat). |
| Symmetry | Rise and fall times are equal — ideal for many natural cycles. | Fails when the rise is fast and the fall is slow (e.g., sawtooth waves in electronics). |
| Smoothness | Infinitely differentiable — excellent for approximation and calculus applications. | Cannot model sharp discontinuities or abrupt regime changes. |
| Simplicity | Only four parameters — easy to interpret and communicate. | May oversimplify complex oscillations that require multiple harmonics. |
| Extrapolation | Can predict future values as long as the periodic pattern persists. | Assumes stationarity — does not account for trends (e.g., global warming shifting the midline). |
Strengths and limitations of the sinusoidal model
KEY TAKEAWAY
SECTION 8
Connections to Advanced Theory
The sinusoidal functions you master in AP Precalculus form the foundation for several advanced topics that you will encounter in calculus, physics, and engineering. This section briefly outlines how the ideas in this lesson connect forward, giving you a roadmap for deeper study.
| AP Precalculus Concept | Advanced Extension | Where You'll See It |
|---|---|---|
| Single sinusoidal model f(x) = a sin(b(x − c)) + d | Fourier series: any periodic function as an infinite sum of sinusoids | Multivariable calculus, signal processing, physics of waves |
| Amplitude and period from context | Damped oscillations: amplitude decays exponentially over time (ae⁻ᵏᵗ sin(ωt)) | Differential equations, mechanical engineering (spring systems) |
| Phase shift c | Wave interference: phase differences cause constructive/destructive superposition | AP Physics, acoustics, optics, quantum mechanics |
| Sinusoidal regression from data | Least-squares fitting and spectral analysis for complex data sets | Statistics, data science, climate modeling |
How AP Precalculus sinusoidal concepts extend to advanced coursework
In AP Calculus, you will differentiate and integrate sinusoidal functions, discovering that the derivative of sin(x) is cos(x) and vice versa — a relationship that explains why velocity and acceleration in circular motion are themselves sinusoidal. In physics, two waves with different phase shifts combine to form interference patterns, and the mathematics of phase that you learn here directly transfers to understanding standing waves and beats. The four-parameter sinusoidal model is thus not just a curve-fitting tool; it is the entry point into a vast and interconnected web of mathematical and scientific ideas.
SECTION 9
Practice Problems
Question 1: CONCEPTUAL
- A. Midline = 40, Amplitude = 20
- B. Midline = 50, Amplitude = 30
- C. Midline = 50, Amplitude = 60
- D. Midline = 60, Amplitude = 20
- E. Midline = 30, Amplitude = 50
Show answer (B)
Question 2: BASIC CALCULATION
- A. Period = 6 hours; first maximum at t = 3
- B. Period = 12 hours; first maximum at t = 3
- C. Period = 12 hours; first maximum at t = 6
- D. Period = 12 hours; first maximum at t = 9
- E. Period = 24 hours; first maximum at t = 6
Show answer (C)
Question 3: INTERMEDIATE
- A. The amplitude should be 56, not 28, because the temperature range is 84 − 28 = 56.
- B. The model is correct: the negative cosine reaches its minimum at m = 1, giving T(1) = 56 − 28 = 28°F, and its maximum at m = 7, giving T(7) = 56 + 28 = 84°F.
- C. The negative sign is wrong; it should be positive because cosine starts at its maximum.
- D. The phase shift should be 7 instead of 1 because the maximum occurs in month 7.
- E. The frequency factor should give a period of 6 months, not 12, because there are only 6 months between the max and min.
Show answer (B)
Question 4: APPLIED
4 ptsShow answer
Question 5: CRITICAL THINKING
3 ptsShow answer
SUMMARY
Lesson Summary
Summary
A sinusoidal function of the form f(x) = a sin(b(x − c)) + d or f(x) = a cos(b(x − c)) + d is characterized by four parameters: the amplitude |a| (half the range), the period T = 2π/|b| (length of one cycle), the phase shift c (horizontal translation), and the midline d (average value). To model real-world data, compute the midline as d = (max + min)/2, the amplitude as |a| = (max − min)/2, the frequency factor as b = 2π/T, and the phase shift by locating a maximum (cosine form) or midline crossing (sine form).
A sinusoidal model is appropriate when data exhibits periodicity, symmetry, and boundedness. Its limitations include the assumption of constant period, symmetric oscillation, and no long-term trend. Always validate your model by substituting known data points back into the function. The sinusoidal model is the gateway to Fourier analysis, damped oscillations, and wave interference — advanced concepts that build directly on the four-parameter framework mastered here.