
SECTION 1
Historical Context & Motivation
The study of sine and cosine functions stretches back thousands of years, rooted in the practical needs of astronomy and land surveying. Ancient civilizations recognized that circular motion generates predictable, repeating patterns—patterns that could be captured numerically and used to predict celestial events with remarkable accuracy. The transition from tabular values to continuous wave-shaped graphs was a conceptual leap that unified geometry, algebra, and analysis, ultimately providing the mathematical language for describing periodic phenomena throughout the sciences.
~150 CE • Ptolemy's Chord Tables
~500 CE • Indian Half-Chord (Jyā)
1635 • Roberval's Sinusoidal Curve
1748 • Euler's Analytic Formulation
1822 • Fourier's Harmonic Analysis
This historical arc reveals a central question: how can we precisely describe, transform, and interpret the characteristic wave-shaped graphs produced by sine and cosine? The AP Precalculus course requires you to fluently read these graphs, connect their features to algebraic parameters, and apply transformations—skills that rest on understanding the underlying unit-circle definitions and the geometric meaning of each parameter.
SECTION 2
Core Principles & Definitions
Before graphing sine and cosine, you must internalize a small set of foundational ideas that govern the behavior of every sinusoidal curve. Each principle connects an algebraic parameter to a visual feature of the graph, creating a two-way fluency: given an equation, you can sketch the graph, and given a graph, you can write the equation. The following grid distills these principles.
Unit-Circle Origin
Periodicity
Amplitude
Phase Shift & Vertical Shift
Sine–Cosine Relationship
KEY TAKEAWAY
SECTION 3
Visual Explanation — Parent Sine & Cosine Graphs
Several features are immediately visible. The sine function begins at the origin (0, 0), rises to its maximum of 1 at x = π/2, returns to 0 at x = π, reaches its minimum of −1 at x = 3π/2, and completes the cycle back at 0 when x = 2π. The cosine function follows the identical shape but starts at its maximum: (0, 1). Both curves are smooth, continuous, and unbounded in domain—they extend infinitely in both directions along the x-axis while their range remains locked to [−1, 1]. Recognizing these key points—intercepts, maxima, and minima—at quarter-period intervals is the single most efficient strategy for sketching either graph by hand.
AP Exam Tip
SECTION 4
Mathematical Framework — The General Sinusoidal Model
The parent functions y = sin(x) and y = cos(x) are special cases of a more powerful general form. By introducing four parameters—amplitude, frequency, phase shift, and vertical shift—we can model any sinusoidal behavior. The AP Precalculus course expects fluency in moving between the equation and the graph in both directions.
GENERAL SINUSOIDAL FORM
A = amplitude (|A| is the distance from midline to peak; if A < 0, the graph reflects over the midline). B = frequency factor (period T = 2π / |B|). C = phase (horizontal) shift (positive C shifts right). D = vertical shift (midline is y = D).
PERIOD
The period is the horizontal length of one complete cycle. Doubling B halves the period, compressing the wave horizontally.
RANGE
The output values oscillate symmetrically about the midline y = D. The maximum value is D + |A| and the minimum is D − |A|.
SINE–COSINE PHASE IDENTITY
This identity confirms that cosine and sine are the same wave separated by a quarter-period phase shift. Any sinusoidal function can be written equivalently in either form by adjusting C.
A critical subtlety involves the sign conventions. When the equation is written as y = A sin(B(x − C)) + D, the phase shift is +C (rightward). However, some textbooks factor differently: y = A sin(Bx − φ) + D, in which case the phase shift is φ/B. On the AP exam, carefully identify which form is being used before extracting the shift. Always verify your reading by checking whether the key points of the graph match your algebraic predictions.
Common Pitfall
SECTION 5
Detailed Breakdown — Transformations of Sinusoidal Graphs
Understanding how each parameter transforms the parent graph is essential for the AP Precalculus exam. Rather than memorizing isolated rules, it is more productive to see each transformation as a geometric operation applied to the parent curve's five key points. The diagram below illustrates how amplitude, period, phase shift, and vertical shift independently alter the graph of y = sin(x).
| Transformation | Parameter Changed | Effect on Graph | Effect on Key Points |
|---|---|---|---|
| Vertical Stretch/Compression | |A| ≠ 1 | Stretches (|A| > 1) or compresses (0 < |A| < 1) vertically | Multiply all y-values by A |
| Reflection over midline | A < 0 | Maxima become minima and vice versa | Negate y-displacements from midline |
| Horizontal Stretch/Compression | |B| ≠ 1 | Period changes to 2π/|B| | Divide all x-values by B |
| Phase Shift | C ≠ 0 | Entire graph translates horizontally | Add C to all x-values |
| Vertical Shift | D ≠ 0 | Midline moves to y = D | Add D to all y-values |
Summary of sinusoidal transformations and their effects
SECTION 6
Worked Example — Graphing a Transformed Sinusoid
Let us graph the function y = −3 cos(2(x − π/4)) + 1 and identify all key features. This example combines every transformation: amplitude change, reflection, period change, phase shift, and vertical shift.
Graph y = −3 cos(2(x − π/4)) + 1
- 1
Step 1 — Identify Parameters
Compare y = −3 cos(2(x − π/4)) + 1 to the general form y = A cos(B(x − C)) + D. We read off: A = −3, B = 2, C = π/4, D = 1.A = −3, B = 2, C = π/4, D = 1 - 2
Step 2 — Determine Amplitude and Reflection
The amplitude is |A| = |−3| = 3. Because A is negative, the graph is reflected over its midline: the parent cosine starts at a maximum, but this graph starts at a minimum.Amplitude = 3, reflected (starts at minimum) - 3
Step 3 — Compute the Period
Period T = 2π / |B| = 2π / 2 = π. One full cycle now spans π radians, half the parent cosine's period.Period = π - 4
Step 4 — Identify Phase Shift and Vertical Shift
The phase shift is C = π/4 to the right. The vertical shift is D = 1, so the midline is y = 1 instead of y = 0. The range is [D − |A|, D + |A|] = [1 − 3, 1 + 3] = [−2, 4].Phase shift = π/4 right; midline y = 1; range [−2, 4] - 5
Step 5 — Plot the Five Key Points
For y = cos(x), the five key points over one cycle [0, 2π] are: (0, 1), (π/2, 0), (π, −1), (3π/2, 0), (2π, 1). Apply transformations in order: divide x by B, add C, multiply y by A, add D. Original → After B: divide x by 2 → After C: add π/4 → After A and D: y becomes −3y + 1. (0, 1) → (0, 1) → (π/4, 1) → (π/4, −3(1)+1) = (π/4, −2) (π/2, 0) → (π/4, 0) → (π/2, 0) → (π/2, −3(0)+1) = (π/2, 1) (π, −1) → (π/2, −1) → (3π/4, −1) → (3π/4, −3(−1)+1) = (3π/4, 4) (3π/2, 0) → (3π/4, 0) → (π, 0) → (π, −3(0)+1) = (π, 1) (2π, 1) → (π, 1) → (5π/4, 1) → (5π/4, −3(1)+1) = (5π/4, −2)Key points: (π/4, −2), (π/2, 1), (3π/4, 4), (π, 1), (5π/4, −2) - 6
Step 6 — Sketch and Verify
Plot the five key points, draw a smooth sinusoidal curve through them, and verify: the minimum is −2 (occurring at x = π/4 and 5π/4), the maximum is 4 (at x = 3π/4), the midline crossings occur at x = π/2 and x = π, and the horizontal distance from minimum to minimum is π, confirming the period.Graph complete. One cycle spans [π/4, 5π/4], midline y = 1, amplitude 3, reflected cosine.
SECTION 7
Comparing Sine and Cosine — Strengths & Modeling Choices
Because sine and cosine differ only by a phase shift, any sinusoidal model can be written using either function. However, choosing wisely can simplify both the equation and its interpretation. The table below highlights practical considerations for modeling and exam contexts.
| Feature | y = A sin(B(x − C)) + D | y = A cos(B(x − C)) + D |
|---|---|---|
| Starting behavior (at x = C) | Starts at midline, moving upward (A > 0) | Starts at maximum (A > 0) |
| Symmetry | Odd function: sin(−x) = −sin(x) | Even function: cos(−x) = cos(x) |
| Best used when data... | Starts at the midline value (e.g., spring at equilibrium) | Starts at an extreme value (e.g., height at top of Ferris wheel) |
| Derivative relationship | d/dx [sin(x)] = cos(x) | d/dx [cos(x)] = −sin(x) |
| Conversion | sin(x) = cos(x − π/2) | cos(x) = sin(x + π/2) |
Practical comparison of sine and cosine forms for modeling
MODELING INSIGHT
 Suppose a wheel has radius 30 m and center height 35 m. Starting at the bottom gives H(α) = 35 − 30 cos α: amplitude 30 m, midline 35 m, and range 5–65 m.
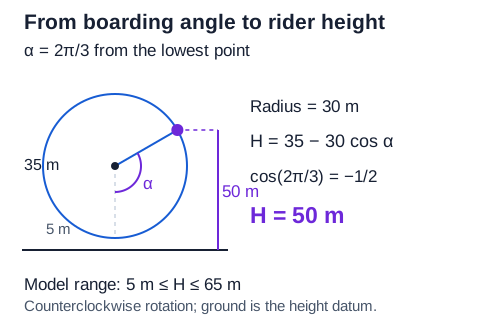 Suppose a wheel has radius 30 m and center height 35 m. Starting at the bottom gives H(α) = 35 − 30 cos α: amplitude 30 m, midline 35 m, and range 5–65 m.Open full diagram
SECTION 8
Connections to Advanced Theory
The graphical analysis of sine and cosine is not an endpoint but a gateway. In calculus, the smooth oscillating behavior of these functions yields elegant derivative and integral relationships. In physics and engineering, the sinusoidal model underpins wave mechanics, alternating-current circuits, and signal processing. Even within the AP Precalculus course itself, the graphical concepts extend to other trigonometric functions and to polar curves.
| Concept in This Lesson | Advanced Extension | Where It Appears |
|---|---|---|
| Amplitude and period | Fourier series: any periodic function = sum of sinusoids with specific amplitudes and periods | AP Physics, multivariable calculus, signal processing |
| Phase shift | Phasor representation of AC circuits; complex exponential form = cos θ + i sin θ | AP Physics C, electrical engineering |
| Sinusoidal shape (concavity) | Second derivative test: d²/dx² sin(x) = −sin(x), showing inflection points coincide with zeros | AP Calculus AB/BC |
| Graphing y = sin(x) on Cartesian plane | Graphing r = sin(θ) on the polar plane produces a circle; r = a + b sin(θ) yields limaçons and cardioids | AP Precalculus Unit 3 (Polar) |
| Range [D − |A|, D + |A|] | Bounded output → the squeeze theorem for limits involving sin(x)/x and oscillating products | AP Calculus AB/BC limits unit |
How sine and cosine graph concepts extend into advanced mathematics and science
Mastering the graphical behavior of sine and cosine now gives you a transferable skill set. When you encounter damped oscillations (y = sin(x)) in differential equations, or when you analyze resonance in physics, you will rely on the same five-key-point strategy, the same parameter-reading techniques, and the same transformation logic developed in this lesson. The language of sinusoids is one of the most widely spoken in all of STEM.
SECTION 9
Practice Problems
Question 1: CONCEPTUAL
- A. The graph of y = cos(x) is a reflection of y = sin(x) over the x-axis.
- B. The graph of y = cos(x) is the graph of y = sin(x) shifted π/2 units to the left.
- C. The graph of y = cos(x) is the graph of y = sin(x) shifted π units to the right.
- D. The graph of y = cos(x) is a vertical stretch of y = sin(x) by a factor of 2.
- E. The graph of y = cos(x) is the graph of y = sin(x) shifted π/2 units to the right.
Show answer (B)
Question 2: BASIC CALCULATION
- A. 3π
- B. 2π/3
- C. 6π
- D. π/3
- E. 2π
Show answer (B)
Question 3: INTERMEDIATE
- A. y = 3 cos(x/2 − π/2) + 4
- B. y = 6 cos(x/2 − π) + 1
- C. y = 3 sin(2x − π) + 4
- D. y = 3 cos(x − π) + 4
- E. y = 3 cos(x/2) + 4
Show answer (A)
Question 4: APPLIED
4 ptsShow answer
Question 5: CRITICAL THINKING
3 ptsShow answer
SUMMARY
Lesson Summary
Summary
The graphs of sine and cosine are smooth, continuous, periodic waves that originate from the unit circle. The parent functions oscillate between −1 and 1 with a period of 2π and an amplitude of 1. The general sinusoidal model y = A sin(B(x − C)) + D (or its cosine equivalent) encodes four transformations: amplitude |A| stretches or compresses vertically, frequency B sets the period to 2π/|B|, phase shift C translates horizontally, and vertical shift D raises or lowers the midline.
The key graphing strategy is to identify the five key points (start, quarter, midpoint, three-quarter, end) of one cycle, apply transformations to each point, and connect them with a smooth curve. Cosine is simply sine shifted by π/2 to the left, so every technique for one function transfers directly to the other. Mastery of these graphs is essential not only for the AP Precalculus exam but also as the foundation for Fourier analysis, polar curves, and calculus-based wave mechanics.