

SECTION 1
Historical Context & Motivation
When scientists first began collecting data on phenomena such as bacterial growth, radioactive decay, and compound interest, they quickly noticed a recurring problem: the numbers grew (or shrank) so rapidly that plotting them on ordinary graph paper produced curves that were either cramped near zero or rocketed off the page. A semi-log plot was the elegant solution—by applying a logarithmic scale to one axis, the explosive curvature of exponential data collapses into a manageable straight line, making trends visible and parameters easy to extract.
1614 • Napier Publishes Logarithms
1780s • Logarithmic Graph Scales Emerge
1846 • Commercial Log-Scale Paper
20th c. • Standard Tool in Sciences
The central question this lesson addresses is deceptively simple: How can we tell whether a data set is truly exponential, and how do we extract its base and initial value? The semi-log plot answers both questions at once—if the transformed data forms a line, the relationship is exponential, and the slope and intercept encode the parameters of the model.
SECTION 2
Core Principles & Definitions
A semi-log plot is a graph in which one axis (typically the vertical axis) uses a logarithmic scale while the other axis retains a standard linear scale. The power of this arrangement rests on a single algebraic identity: taking the logarithm of an exponential function yields a linear function. Understanding the following foundational ideas will equip you to read, construct, and interpret semi-log plots on the AP Precalculus exam.
Logarithmic Axis
Linearization
Linearity Test
Slope ↔ Growth/Decay Rate
KEY TAKEAWAY
SECTION 3
Visual Explanation
The diagram below places two plots side by side. On the left, the exponential function y = 2(3)x is graphed on standard linear axes—notice how the curve accelerates steeply upward. On the right, the same data is plotted on a semi-log grid where the vertical axis is scaled by log₁₀; the result is a straight line whose slope equals log(3) ≈ 0.477.
Notice how the five data points on the left panel (x = 0, 1, 2, 3, 4 corresponding to y = 2, 6, 18, 54, 162) hug the x-axis for small values and then surge upward—this makes it difficult to read any intermediate values with precision. On the semi-log plot in the right panel, the same points fall neatly on a line because the vertical axis is scaled by log₁₀. The constant spacing between consecutive points along the vertical direction confirms that the ratio between successive y-values is constant—the hallmark of an exponential function.
SECTION 4
Mathematical Framework
The algebraic justification for semi-log plots hinges on the logarithmic transformation of an exponential model. Suppose a quantity y depends on x according to the general exponential form. Applying the common logarithm (log₁₀) to both sides converts the equation into a linear form whose parameters are directly readable from the graph.
EXPONENTIAL MODEL
a = initial value (y-value when x = 0), b = base (constant multiplicative factor per unit increase in x).
LOGARITHMIC TRANSFORMATION
Letting Y = log₁₀(y), this becomes Y = log₁₀(a) + log₁₀(b) · x, a linear equation in x and Y.
SLOPE AND INTERCEPT
The slope of the line on the semi-log plot encodes the base b, and the vertical intercept encodes the initial value a. Recover both by exponentiating with base 10.
Natural Log Variant
This framework reveals why semi-log plots are so powerful for data analysis. Determining whether a data set is exponential reduces to a visual linearity check, and extracting the model parameters requires only computing the slope and intercept of the best-fit line, then raising 10 to those values.
SECTION 5
Reading & Constructing Semi-log Plots
On the AP Precalculus exam, you may be given a semi-log plot and asked to determine the exponential model, or given data and asked to decide which type of plot linearizes it. The diagram below illustrates how to read key features: the y-intercept of the line gives log₁₀(a), two well-separated points let you compute the slope, and the sign of the slope tells you whether the model describes growth or decay.
- Step 1 — Identify two points on the line. Choose points far apart for accuracy, such as (x₁, log y₁) and (x₂, log y₂).
- Step 2 — Compute slope. m = (log y₂ − log y₁) / (x₂ − x₁). This equals log₁₀(b).
- Step 3 — Recover b. b = .
- Step 4 — Recover a. a = , where the Y-intercept is log₁₀(y) at x = 0.
SECTION 6
Worked Example
A biologist measures the number of bacteria in a culture at regular one-hour intervals. She plots the data on a semi-log graph (log₁₀ of population vs. time in hours) and observes a straight line passing through the points (0, 2) and (5, 3.5). Determine the exponential model for the population P as a function of time t.
Finding the Exponential Model from a Semi-log Line
- 1
Step 1 — Identify the linear form
On the semi-log plot the vertical coordinate is log₁₀(P) and the horizontal coordinate is t. The equation of the line is log₁₀(P) = mt + c, where m is the slope and c is the vertical intercept. - 2
Step 2 — Calculate the slope
Using the two given points (t₁, log P₁) = (0, 2) and (t₂, log P₂) = (5, 3.5): m = (3.5 − 2) / (5 − 0) = 1.5 / 5 = 0.3.m = 0.3 - 3
Step 3 — Read the intercept
At t = 0 the semi-log plot gives log₁₀(P) = 2, so c = 2.c = 2 - 4
Step 4 — Recover b and a
The base is b = = ≈ 1.995 ≈ 2, and the initial value is a = = 10² = 100.b ≈ 2, a = 100 - 5
Step 5 — Write the model
The exponential model is P(t) = 100 · . The population doubles every hour, starting from 100 bacteria.P(t) = 100 ·
 The line log₁₀P = 0.3t + 2 gives P = 100×10^(0.3t). Its hourly growth factor is about 1.995.
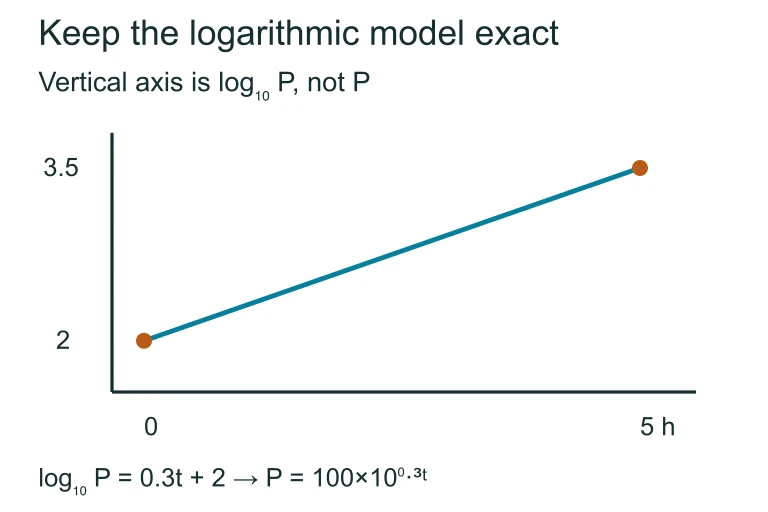 The line log₁₀P = 0.3t + 2 gives P = 100×10^(0.3t). Its hourly growth factor is about 1.995.
SECTION 7
Semi-log vs. Linear and Log-log Plots
Semi-log plots are one member of a family of transformed-axis plots. Choosing the right plot type depends on the suspected relationship between variables. The table below compares three common options so you can quickly decide which is appropriate for a given data set—an important skill tested in the free-response section of the AP Precalculus exam.
| Feature | Linear Plot | Semi-log Plot | Log-log Plot |
|---|---|---|---|
| Axes | Both linear | x linear, y logarithmic | Both logarithmic |
| Linearizes | y = mx + c (linear) | y = a· (exponential) | y = a· (power) |
| Slope gives | Rate of change m | log₁₀(b) | Exponent n |
| Intercept gives | y-intercept c | log₁₀(a) | log₁₀(a) |
| Typical use | Constant-rate processes | Population growth, radioactive decay, compound interest | Allometric scaling, Kepler's law |
Comparison of three common plot types used to linearize data
KEY TAKEAWAY
SECTION 8
Connection to Regression & Advanced Theory
On the AP Precalculus exam, the semi-log plot serves as a graphical gateway to exponential regression. In a statistics or calculus course, you would use least-squares regression on the transformed data (x, log y) to find the best-fit line, then convert the parameters back to the exponential scale. The table below connects the semi-log concepts you have learned to their more advanced counterparts.
| AP Precalculus Concept | Advanced Extension |
|---|---|
| Visual linearity check on semi-log plot | Residual analysis and R² value in exponential regression |
| Slope = log₁₀(b) | Continuous growth rate k when model is y = , slope = k/ln(10) |
| Common log (base 10) | Natural log (base e) preferred in calculus for differentiation |
| Two-point slope calculation | Least-squares fit minimizing Σ(log yᵢ − (mx + c))² |
The semi-log framework also connects to the broader idea of function transformations that pervade AP Precalculus and beyond. Whenever a relationship appears nonlinear, applying the right transformation—logarithmic, reciprocal, square root—can reveal hidden linearity and make the underlying model accessible through the simple tools of slope-intercept analysis.
SECTION 9
Practice Problems
Question 1: CONCEPTUAL
- A. y = mx + c (linear)
- B. y = ax² (quadratic)
- C. y = a · (exponential)
- D. y = a · ln(x) (logarithmic)
- E. y = a/x (reciprocal)
Show answer (C)
Question 2: BASIC CALCULATION
- A. b ≈ 1.68
- B. b ≈ 2.00
- C. b ≈ 7.94
- D. b = 0.3
- E. b ≈ 2.82
Show answer (B)
Question 3: INTERMEDIATE
- A. y = 1000
- B. y = 3
- C. y = 1000
- D. y = 1000
- E. y = 0.631
Show answer (D)
Question 4: APPLIED
4 ptsShow answer
Question 5: CRITICAL THINKING
3 ptsShow answer
SUMMARY
Lesson Summary
Summary
A semi-log plot graphs data with a logarithmic vertical axis and a linear horizontal axis. When data of the form y = a · bx is plotted this way, the result is a straight line because the logarithmic transformation converts the exponential relationship into the linear form log₁₀(y) = log₁₀(a) + x · log₁₀(b).
The slope of the semi-log line equals log₁₀(b), so the base is recovered as b = 10slope. The y-intercept equals log₁₀(a), giving a = 10intercept. A positive slope signals exponential growth (b > 1), while a negative slope signals exponential decay (0 < b < 1). If the data curves on the semi-log plot, the relationship is not purely exponential—consider a log-log plot to test for a power model instead.