
SECTION 1
Historical Context & Motivation
Long before the familiar x-y grid became the default language of analytic geometry, mathematicians recognized that certain curves — spirals, petals, and closed loops — resist clean description in rectangular coordinates. The polar coordinate system arose precisely to address this limitation, offering a framework in which distance from an origin and angle from a reference direction serve as the two fundamental measurements. This system transforms complicated algebraic expressions into strikingly simple equations, revealing underlying symmetry that Cartesian representations obscure.
~200 BCE • Archimedean Spiral
1637 • Cartesian Coordinates Formalized
1691 • Jakob Bernoulli & the Lemniscate
1748 • Euler's Introductio
Modern • AP Precalculus Curriculum
The central question that motivates this lesson is deceptively simple: given a rule r = f(θ), how do we visualize the resulting curve in the plane, determine its symmetry, and identify its key features? Answering this question requires understanding how the interplay of radius and angle generates shapes that are both beautiful and analytically powerful — from the spiral paths of galaxies to the radiation patterns of antennas.
SECTION 2
Core Principles & Definitions
Before graphing any polar function, you need a firm grasp of the coordinate system itself and the conventions that govern how curves are traced. In polar coordinates, every point in the plane is specified by an ordered pair (r, θ), where r is the directed distance from the pole (origin) and θ is the angle measured counterclockwise from the polar axis (positive x-axis). A critical distinction from Cartesian coordinates is that negative values of r are meaningful: when r < 0, the point is plotted in the direction opposite to angle θ.
The Pole & Polar Axis
Directed Radius r
Non-Unique Representation
Conversion Formulas
Symmetry Tests
KEY TAKEAWAY
SECTION 3
Visual Explanation — The Polar Grid
The diagram above illustrates the essential structure of polar graphing. Concentric circles mark constant values of r, while radial lines emanate at standard angles — 0, π/6, π/4, π/3, π/2, and their multiples. When graphing a polar function r = f(θ), you evaluate f at each angle, measure the resulting distance outward along that ray, and then connect the plotted points smoothly. The cardioid shown is a member of the limaçon family of curves — specifically, the special case where the loop just touches the pole without crossing through it. This characteristic heart shape emerges whenever the equation takes the form r = a + a cos θ or r = a + a sin θ, making the coefficients equal.
AP Exam Tip
SECTION 4
Mathematical Framework
The algebraic machinery behind polar graphs involves several families of equations, each producing a characteristic shape. Understanding these canonical forms allows you to predict the shape of a polar curve before plotting a single point. The following equations and their properties form the backbone of the AP Precalculus polar graphing toolkit.
CIRCLES THROUGH THE POLE
These equations produce circles of diameter |a|. The cosine version is centered on the polar axis (x-axis); the sine version is centered on the line θ = π/2 (y-axis). The parameter a determines the diameter, with the circle passing through the pole.
ROSE CURVES
Rose curves produce petal-shaped patterns. When n is odd, the rose has exactly n petals; when n is even, the rose has 2n petals. Each petal extends to a maximum distance of |a| from the pole. The angle between consecutive petals is π/n for an odd n and π/(2n) for an even n.
LIMAÇONS
The ratio a/b determines the limaçon's shape: if a/b < 1, there is an inner loop; if a/b = 1, the curve is a cardioid; if 1 < a/b < 2, a dimpled limaçon appears; if a/b ≥ 2, the curve is convex (no dimple). The parameter a shifts the curve away from the pole, while b controls the amplitude of oscillation.
LEMNISCATES
Lemniscates are figure-eight curves symmetric about the pole. The cosine version is symmetric about both the polar axis and the line θ = π/2; the sine version is symmetric about the lines θ = π/4 and θ = 3π/4. Only angles where cos 2θ ≥ 0 (or sin 2θ ≥ 0) produce real values of r.
When Does r = 0? Identifying Pole Passages
A polar curve passes through the pole whenever f(θ) = 0 for some value of θ. These angles are critical because they mark the directions along which the curve arrives at and departs from the origin. For example, the rose r = 4 sin 3θ equals zero when 3θ = 0, π, 2π, 3π, … , i.e., θ = 0, π/3, 2π/3, π. Each of these angles represents a boundary between petals, and plotting them first establishes the angular framework of the curve.
Maximum and Minimum Values of r
The maximum value of |r| determines how far the curve extends from the pole, and the angles at which this maximum occurs identify the tips of petals, the outermost point of a limaçon, or the widest part of a circle. For r = a + b cos θ, the maximum value of r is |a| + |b| occurring at θ = 0 (for the "+" case), and the minimum value is |a| − |b|. If this minimum is negative, the curve has an inner loop. For rose curves r = a cos(nθ), the maximum distance is simply |a|, occurring at angles where cos(nθ) = ±1.
SECTION 5
Detailed Breakdown of Polar Curve Families
Polar curves can be organized into distinct families based on their equations and the shapes they produce. The diagram below compares four fundamental curve types side by side, illustrating how different equations yield dramatically different geometries. Mastering these families is essential for the AP exam, where you will be expected to match equations to graphs and analyze features without extensive computation.
| Curve Family | General Equation | Key Feature | Passes Through Pole? |
|---|---|---|---|
| Circle | r = a cos θ or r = a sin θ | Diameter = |a|, centered at (a/2, 0) or (0, a/2) | Yes |
| Cardioid | r = a ± a cos θ or r = a ± a sin θ | Heart-shaped; a/b = 1 | Yes (once) |
| Limaçon with loop | r = a + b cos θ (a/b < 1) | Inner loop when |a| < |b| | Yes (twice) |
| Rose | r = a cos(nθ) or r = a sin(nθ) | n odd → n petals; n even → 2n petals | Yes (between petals) |
| Lemniscate | r² = a² cos 2θ or r² = a² sin 2θ | Figure-eight; symmetric about the pole | Yes (center crossing) |
Summary of the five most-tested polar curve families on the AP Precalculus exam.
SECTION 6
Worked Example — Graphing a Rose Curve
Let us graph the polar function r = 4 sin 2θ completely, identifying all key features. This is a rose curve with n = 2, so we expect 2n = 4 petals.
Graphing r = 4 sin 2θ
- 1
Step 1 — Identify the Curve Type
The equation has the form r = a sin(nθ) with a = 4 and n = 2. Since n = 2 is even, the rose curve will have 2n = 4 petals. Each petal extends a maximum distance of |a| = 4 from the pole.4-petal rose, maximum r = 4 - 2
Step 2 — Find Where r = 0 (Pole Passages)
Set 4 sin 2θ = 0, so sin 2θ = 0, giving 2θ = 0, π, 2π, 3π, 4π. Therefore θ = 0, π/2, π, 3π/2, 2π. These five angles (four distinct directions in [0, 2π)) mark the boundaries between petals.r = 0 at θ = 0, π/2, π, 3π/2 - 3
Step 3 — Find Maximum r (Petal Tips)
The maximum of |sin 2θ| is 1, occurring when 2θ = π/2, 3π/2, 5π/2, 7π/2, i.e., θ = π/4, 3π/4, 5π/4, 7π/4. At θ = π/4 and 5π/4, sin 2θ = 1 so r = 4 (positive, plotted along the ray). At θ = 3π/4 and 7π/4, sin 2θ = −1 so r = −4 (plotted opposite the ray direction). Each of these four angles corresponds to the tip of a petal.Petal tips at θ = π/4, 3π/4, 5π/4, 7π/4 with |r| = 4 - 4
Step 4 — Build a Value Table
Evaluate r at several key angles: θ = 0 → r = 0; θ = π/6 → r = 4 sin(π/3) = 4(√3/2) = 2√3 ≈ 3.46; θ = π/4 → r = 4 sin(π/2) = 4; θ = π/3 → r = 4 sin(2π/3) = 4(√3/2) = 2√3 ≈ 3.46; θ = π/2 → r = 4 sin π = 0. This traces one complete petal from θ = 0 to θ = π/2. The pattern repeats for the remaining three quadrants.Each petal spans a π/2 interval of θ - 5
Step 5 — Check Symmetry
Replace θ with −θ: r = 4 sin(−2θ) = −4 sin 2θ ≠ 4 sin 2θ, so the curve is not symmetric about the polar axis by this test alone. However, replacing r with −r and θ with −θ: −r = −4 sin 2θ gives r = 4 sin 2θ ✓, confirming symmetry about the pole. Additionally, replacing θ with π − θ: r = 4 sin(2π − 2θ) = −4 sin 2θ, and since replacing r with −r restores the original equation, the curve also has symmetry about θ = π/2. Together, these confirm the four-fold symmetry we expect.Symmetric about the pole and θ = π/2 - 6
Step 6 — Sketch the Graph
Plot the points from the value table on polar graph paper, connecting them smoothly. The first petal rises from the pole along θ = 0, reaches its tip at (4, π/4) in the first quadrant, and returns to the pole at θ = π/2. The remaining three petals appear in quadrants II, III, and IV, each oriented at π/4, 3π/4, 5π/4, and 7π/4 respectively, creating a four-petal flower centered at the origin.Four petals in quadrants I–IV, tips on the lines θ = π/4, 3π/4, 5π/4, 7π/4
SECTION 7
Polar vs. Cartesian — Strengths & Limitations
Neither polar nor Cartesian coordinates are universally superior — each system has domains where it excels and situations where it introduces unnecessary complexity. Understanding when to use polar representation versus rectangular representation is itself a testable skill on the AP exam and a valuable mathematical habit of mind.
| Feature | Polar Coordinates | Cartesian Coordinates |
|---|---|---|
| Curves with rotational symmetry | Natural fit — circles, roses, spirals have simple equations | Often requires implicit or parametric forms; equations are complicated |
| Linear functions | Cumbersome; a line through the origin is θ = c, but other lines require r = a / (b cos θ + c sin θ) | Simple: y = mx + b |
| Point representation | Non-unique — infinitely many (r, θ) pairs for each point | Unique — exactly one (x, y) pair per point |
| Intersection finding | Tricky — must also check the pole separately due to non-unique representations | Straightforward — set equations equal and solve |
| Applications | Antenna patterns, orbital mechanics, microphone pickup patterns, fluid flow around cylinders | Architecture, engineering blueprints, standard data plotting, linear models |
When to choose polar vs. Cartesian representation.
KEY TAKEAWAY
SECTION 8
Connection to Advanced Theory
The polar graphing skills you develop in AP Precalculus form the foundation for several important topics in calculus and beyond. In AP Calculus BC, you will compute areas enclosed by polar curves using the integral A = (1/2)∫r² dθ, and you will find arc lengths using ds = √(r² + (dr/dθ)²) dθ. The ability to identify where a curve passes through the pole, where it reaches maximum r, and which intervals of θ trace distinct portions of the curve directly determines how you set up these integrals.
| AP Precalculus Skill | Advanced Extension |
|---|---|
| Plotting r = f(θ) and identifying key features | Setting up bounds for polar area integrals in Calculus BC |
| Analyzing maximum and minimum values of r | Finding extreme distances and tangent lines using dr/dθ |
| Recognizing rose, limaçon, and lemniscate families | Complex analysis (z = ), Fourier analysis of periodic patterns |
| Converting between polar and Cartesian forms | Multivariable calculus: polar double integrals, Jacobian determinant |
| Symmetry analysis of polar curves | Group theory applications in physics and crystallography |
How AP Precalculus polar skills connect to advanced mathematics.
Beyond pure mathematics, polar functions model real phenomena with remarkable elegance. The radiation pattern of a dipole antenna is a figure-eight described by r = cos θ, while cardioid microphones derive their name from the heart-shaped polar sensitivity pattern r = 1 + cos θ. In orbital mechanics, Kepler's first law states that planetary orbits are ellipses with the Sun at one focus — an ellipse whose polar equation r = a(1 − e²)/(1 + e cos θ) directly encodes the eccentricity e and semi-major axis a.
SECTION 9
Practice Problems
Question 1: CONCEPTUAL
- A. 3 petals, maximum distance 5
- B. 6 petals, maximum distance 5
- C. 3 petals, maximum distance 15
- D. 6 petals, maximum distance 15
- E. 3 petals, maximum distance 3
Show answer (A)
Question 2: BASIC CALCULATION
- A. θ = π/6
- B. θ = 7π/6 and θ = 11π/6
- C. θ = π/2
- D. θ = 3π/2
- E. The curve never passes through the pole
Show answer (B)
Question 3: INTERMEDIATE
- A. r = 5 + 3 cos θ
- B. r = 4 + 4 sin θ
- C. r = 2 + 5 cos θ
- D. r = 6 + 3 sin θ
- E. r = 3 cos 2θ
Show answer (C)
Question 4: APPLIED
4 ptsShow answer
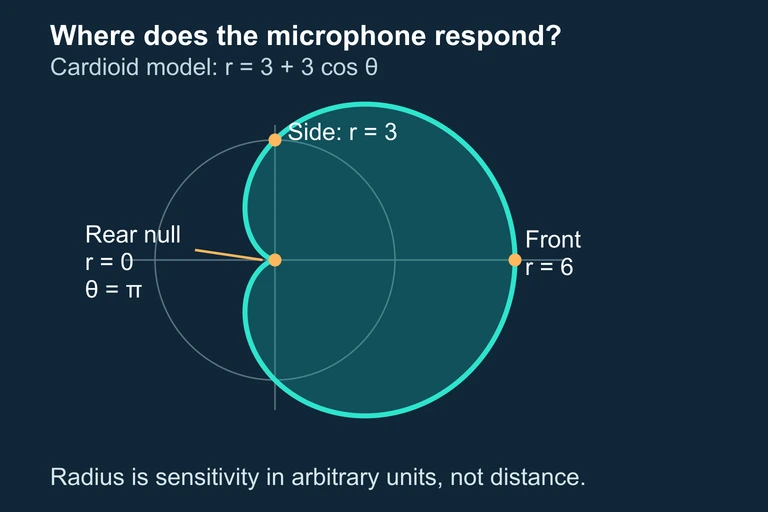 The microphone cardioid compares front, side and rear sensitivity; its radial coordinate is not geographic coverage.
Question 5: CRITICAL THINKING
3 ptsShow answer
SUMMARY
Lesson Summary
Summary
Polar function graphs describe curves using the relationship r = f(θ), where each point is determined by a directed distance r from the pole and an angle θ from the polar axis. The major curve families include circles (r = a cos θ or a sin θ), limaçons and cardioids (r = a ± b cos θ, classified by the ratio a/b), rose curves (r = a cos nθ, with n petals if n is odd and 2n petals if n is even), and lemniscates (r² = a² cos 2θ).
To graph any polar function, identify the curve family from its equation, find where r = 0 (pole passages), determine the maximum value of |r| and the angles where it occurs, test for symmetry (about the polar axis, the line θ = π/2, or the pole), and build a θ-r value table at key angles. Remember that polar representations are non-unique, so intersection problems and symmetry tests require careful attention to alternate forms. These skills lay the groundwork for polar area and arc length integrals in Calculus BC and beyond.