
SECTION 1
Historical Context & Motivation
The act of choosing a mathematical function to describe observed phenomena is as old as quantitative science itself. Long before graphing calculators or regression software existed, mathematicians and natural philosophers confronted a fundamental question: given a set of observations, which algebraic form best captures the underlying relationship? This question drives function model selection—the deliberate process of matching data behavior to a function family—and it demands that the modeler explicitly state every assumption that justifies the choice. Without such assumption articulation, a model's predictive power cannot be evaluated, and its domain of validity remains unknown.
~300 BCE • Euclid's Proportional Reasoning
1615 • Kepler's Polynomial Interpolation
1805 • Legendre's Least Squares Method
1974 • Akaike Information Criterion
The central gap that this lesson addresses is the space between recognizing data patterns and rigorously defending a modeling choice. On the AP Precalculus exam, you are expected not merely to identify whether data looks linear, quadratic, or rational, but to articulate why a particular function family is appropriate, what assumptions are embedded in that choice, and under what conditions the model may break down. This synthesis of quantitative reasoning and verbal justification is the hallmark of mathematical maturity.
SECTION 2
Core Principles & Definitions
Function model selection rests on several interconnected principles that guide the modeler from raw data to a justified algebraic representation. Understanding these principles transforms model selection from guesswork into a disciplined analytical process. Each principle carries embedded assumptions that must be made explicit whenever a model is proposed or defended.
End Behavior & Dominance
Rate of Change Patterns
Zeros, Poles, and Discontinuities
Concavity and Inflection
Parsimony (Simplicity)
KEY TAKEAWAY
SECTION 3
Visual Explanation — Comparing Function Families
The diagram below places four major function families on the same coordinate axes so that their contrasting behaviors become visually immediate. When selecting a model, ask yourself which curve's qualitative shape most closely mirrors the data's overall trajectory, paying particular attention to end behavior, symmetry, and the presence or absence of asymptotes.
Notice how each function family carries distinct structural signatures. A linear model assumes a constant rate of change—an assumption that must be verified by inspecting first differences or a scatter plot. A quadratic model assumes a single turning point and that both ends of the graph point in the same direction, implying constant second differences. Selecting a cubic or higher-degree polynomial assumes additional turning points and an inflection structure that the data must support. Finally, choosing a rational model assumes the existence of input values where the function is undefined—a qualitative feature absent from all polynomial models. Articulating these assumptions is what transforms a curve-fitting exercise into genuine mathematical modeling.
SECTION 4
Mathematical Framework
The mathematical backbone of model selection involves analyzing the algebraic structure of candidate function families and matching their properties to observed data. Below are the key forms and the diagnostic tests associated with each. In every case, the assumptions required by each model type are stated alongside the formula.
POLYNOMIAL OF DEGREE n
where aₙ ≠ 0. Assumptions: The function is continuous for all real x, has at most n − 1 turning points, and the nth finite differences of equally spaced data are constant.
RATIONAL FUNCTION
The degree of p is m and the degree of q is n. Assumptions: There exist values of x where the output is undefined (vertical asymptotes or holes). If m < n, HA at y = 0. If m = n, HA at y = aₘ/bₙ. If m > n, no horizontal asymptote (slant or polynomial end behavior).
FINITE DIFFERENCE TEST (DEGREE n)
For equally spaced inputs with step size h, the nth forward differences of a polynomial of degree n are constant. If Δ¹ values are constant → linear. If Δ² values are constant → quadratic. This test assumes equally spaced inputs—a critical assumption often overlooked on exams.
HORIZONTAL ASYMPTOTE CRITERION
When selecting a rational model, the end behavior is determined by comparing the degrees m (numerator) and n (denominator). This limit analysis assumes that the data eventually stabilizes toward a long-run value, which must be supported by the context of the problem.
AP Exam Tip
SECTION 5
Model Selection Decision Framework
The following decision diagram provides a systematic workflow for choosing among polynomial and rational function models. Rather than relying on visual intuition alone, this framework uses a sequence of diagnostic questions—each tied to a specific mathematical assumption—to narrow the field of candidate models. Work from the top down, and at each decision node, verify the corresponding assumption against your data.
When using this flowchart on an exam, remember that the finite difference test carries a built-in assumption: the input values must be equally spaced. If the x-values in your table are not equally spaced, you must either re-interpolate or rely on other diagnostic criteria such as the number of turning points, the presence of inflection points, or the scatter plot's qualitative shape. Additionally, in applied problems, contextual clues—such as a population that cannot exceed a carrying capacity—may directly suggest a rational model whose horizontal asymptote represents the limit, even before any numerical test is performed.
SECTION 6
Worked Example — Selecting and Justifying a Model
A biologist records the concentration of a nutrient (mg/L) in a lake at equally spaced weekly intervals. The data are shown below. Determine an appropriate function model and articulate the assumptions that support your choice.
| Week (t) | Concentration C(t) |
|---|---|
| 0 | 2.0 |
| 1 | 5.0 |
| 2 | 8.0 |
| 3 | 9.5 |
| 4 | 10.0 |
| 5 | 10.3 |
| 6 | 10.4 |
Nutrient concentration data measured at weekly intervals
Selecting a Model for Nutrient Concentration
- 1
Step 1 — Examine End Behavior
The concentration increases from 2.0 to 10.4 mg/L, while the increments decrease from 3.0 to 0.1. This observed slowing is consistent with leveling, but the finite observations do not establish an asymptote. A rational function is one candidate if a finite limiting concentration is independently justified.Candidate only: rational model with an assumed horizontal asymptote. - 2
Step 2 — Compute First Differences (Verification)
First differences are 3.0, 3.0, 1.5, 0.5, 0.3, 0.1; second differences are 0, −1.5, −1.0, −0.2, −0.2. Their variation rules out exact linear and exact quadratic interpolation of every point. It does not exclude all higher-degree polynomials, nor prove long-run leveling.No exact linear or quadratic fit; finite data do not determine end behavior. - 3
Step 3 — Propose a Specific Rational Form
Assume, as a candidate rather than a measured fact, that the limiting concentration is 10.5 mg/L. Explore C(t) = (at + b)/(t + c). Here, the degree of the numerator equals the degree of the denominator (both degree 1), so the horizontal asymptote is y = a/1 = a. We estimate a ≈ 10.5. Using C(0) = 2 gives b/c = 2, and using C(1) = 5 gives (a + b)/(1 + c) = 5. Solving this system with a = 10.5 yields approximately: C(t) = (10.5t + 2·c)/(t + c). From C(0) = 2: b = 2c. From C(1) = 5: (10.5 + 2c)/(1 + c) = 5, so 10.5 + 2c = 5 + 5c, giving c = 11/6 ≈ 1.833 and b ≈ 3.667.Candidate: C(t) = (10.5t + 11/3)/(t + 11/6). It matches t = 0,1 but predicts C(2) ≈ 6.435 and C(6) ≈ 8.511, below observed 8.0 and 10.4. It is not validated by the full series. - 4
Step 4 — Articulate Assumptions
This candidate assumes continuous concentration for t ≥ 0, a finite limit of 10.5 mg/L, and a diminishing rate of increase. These are modeling assumptions, not consequences proved by the seven observations. The substantial underprediction at weeks 2 and 6 shows that fitting the first two points is insufficient. A better-supported model would require further fitting and validation before prediction.Assumptions stated; the candidate fails to fit the full series closely.
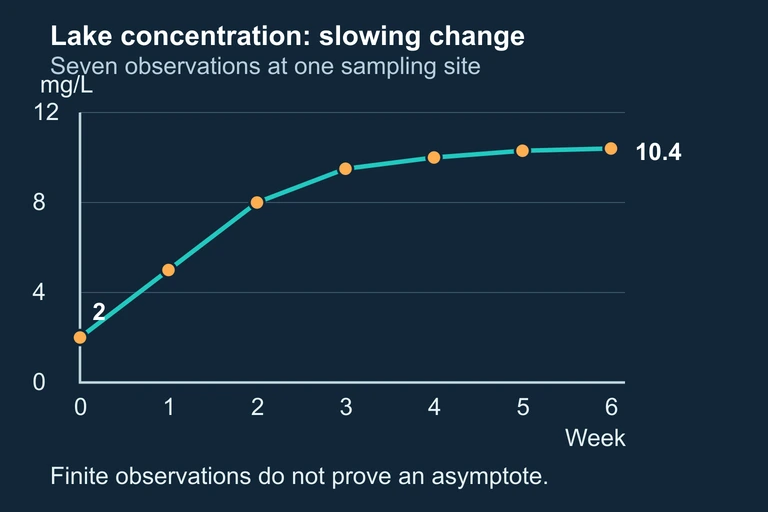 Seven observed lake concentrations suggest leveling within the observed window but cannot establish a unique horizontal asymptote.
SECTION 7
Strengths and Limitations of Each Model Family
No single function family is universally superior. Each model type has inherent strengths—contexts in which its assumptions align well with reality—and limitations—situations where its structural constraints cause it to misrepresent the data. The table below provides a side-by-side comparison that is especially useful when defending a model choice on free-response questions.
| Model Family | Key Strengths | Key Limitations |
|---|---|---|
| Linear | Simplest model; fewest assumptions; excellent local approximation over short intervals; constant rate of change is easy to interpret. | Cannot model curvature, turning points, or bounded growth. Extrapolation often fails for large domains. |
| Quadratic | Models one turning point (max or min); constant second differences are easily verified; physically meaningful for projectile and area problems. | Symmetric parabolic shape may not match data; always unbounded for large |x|; cannot model asymptotic behavior. |
| Cubic / Higher Degree | Models multiple turning points and inflection; flexible shape; higher-degree polynomials can interpolate through any finite data set exactly. | Overfitting risk with higher degrees; wild oscillation between data points (Runge's phenomenon); strong assumptions needed for extrapolation. |
| Rational | Models asymptotic behavior (horizontal, vertical, slant); captures bounded growth and long-run limits; essential for rate and proportion problems. | Introduces discontinuities that may not exist in the physical context; more parameters to determine; domain restrictions must be contextually justified. |
Comparison of polynomial and rational function families for model selection
KEY TAKEAWAY
SECTION 8
Connections to Advanced Theory
The model selection skills you develop in AP Precalculus form the foundation for more sophisticated techniques encountered in calculus, statistics, and applied mathematics. The table below maps the precalculus concepts covered in this lesson to their more advanced counterparts, illustrating how assumption articulation becomes even more critical as models grow in complexity.
| AP Precalculus Concept | Advanced Extension |
|---|---|
| Finite difference test for polynomial degree | Taylor polynomial approximation: nth-degree Taylor polynomials generalize finite differences to non-equally-spaced data via derivatives |
| Horizontal asymptote as long-run value | Formal limits at infinity in calculus; L'Hôpital's rule for indeterminate forms arising from rational expressions |
| Choosing between model families based on data | Statistical regression and model comparison using R², AIC, and BIC in AP Statistics and beyond |
| Articulating domain restrictions | Continuity and differentiability conditions in real analysis; piecewise function models in applied mathematics |
| Parsimony (prefer simpler model) | Occam's Razor formalized as the bias-variance tradeoff in machine learning; regularization techniques to prevent overfitting |
Mapping precalculus model selection concepts to advanced mathematical frameworks
Looking forward, the habit of explicitly stating assumptions—"I chose a rational model because the data approach a limiting value, and I assume this limit exists because the physical context involves a saturation process"—transfers directly to writing scientific reports, engineering design documents, and statistical analyses. In each of these advanced contexts, the strength of a conclusion is only as strong as the clarity and validity of the assumptions that support it. Developing this disciplined approach now will serve you well in any quantitative field you pursue.
SECTION 9
Practice Problems
Question 1: CONCEPTUAL
- A. A degree-4 polynomial can only have four x-intercepts, so it cannot pass through five points.
- B. Passing through all data points exactly does not mean the model captures the underlying relationship; the degree-4 polynomial may overfit the data by conforming to noise rather than the true trend, violating the principle of parsimony.
- C. Degree-4 polynomials are undefined for certain values of x, making them unreliable models.
- D. A degree-4 polynomial always has exactly four turning points, which is too many for most real-world data sets.
- E. Polynomial models cannot be used unless the data have equally spaced inputs.
Show answer (B)
Question 2: BASIC CALCULATION
- A. 1 (linear)
- B. 2 (quadratic)
- C. 3 (cubic)
- D. 4 (quartic)
- E. The finite difference test cannot be applied because the step size is 2, not 1.
Show answer (B)
Question 3: INTERMEDIATE
- A. Horizontal asymptote at y = 2, vertical asymptotes at x = 2 and x = −2, no holes.
- B. Horizontal asymptote at y = 0, vertical asymptotes at x = 2 and x = −2, no holes.
- C. Slant asymptote y = 2x + 3, vertical asymptotes at x = 2 and x = −2.
- D. Horizontal asymptote at y = 2, vertical asymptote at x = −2 only, with a hole at x = 2.
- E. Horizontal asymptote at y = 2, vertical asymptote at x = 2 only, with a hole at x = −2.
Show answer (A)
Question 4: APPLIED
7 ptsShow answer
Question 5: CRITICAL THINKING
4 ptsShow answer
SUMMARY
Lesson Summary
Summary
Function model selection requires you to match data behavior to the structural properties of a function family. Begin by examining end behavior: does the output grow without bound (polynomial) or approach a horizontal asymptote (rational)? Next, apply the finite difference test to equally spaced data to identify the polynomial degree: constant first differences signal linear, constant second differences signal quadratic, and so on. For rational models, compare the degrees of the numerator and denominator to determine the asymptotic structure, and verify that the data support the existence of excluded input values.
Equally important is assumption articulation: every model carries embedded assumptions about continuity, rate of change patterns, domain restrictions, and end behavior that must be explicitly stated and defended with evidence from the data or the problem's real-world context. Adhere to the principle of parsimony—choose the simplest model whose assumptions are satisfied—and always check that your model's behavior is physically or contextually reasonable, especially for extrapolation beyond the observed data range. Mastering this synthesis of quantitative analysis and verbal justification is a cornerstone of success on the AP Precalculus exam.