

SECTION 1
Historical Context & Motivation
The question of how to choose the right mathematical model for a data set is as old as the scientific method itself. When scientists first began collecting systematic measurements—population counts, radioactive decay readings, financial records—they faced a fundamental challenge: multiple function families can appear to fit the same data over a limited domain. A linear model, a quadratic model, and an exponential model might all seem reasonable when you only have five or six data points clustered in a narrow interval. Competing function model validation is the systematic process of testing rival function types against data to determine which one captures the underlying relationship most faithfully.
1805 • Least Squares Method
1838 • Verhulst's Logistic Model
1900s • Residual Analysis Emerges
2000s • AP Curriculum Integration
The central question this lesson addresses is deceptively simple: given a data set, how do you decide whether a linear, quadratic, exponential, or logarithmic model is most appropriate? The answer requires you to move beyond curve-fitting intuition and employ structural tests—analyzing rates of change, residual patterns, and end behavior to discriminate among competing models.
SECTION 2
Core Principles of Model Validation
Model validation rests on a few foundational ideas that connect algebraic structure to data behavior. Each function family—linear, quadratic, exponential, logarithmic—has a unique algebraic signature that manifests in the data's first and second differences, ratios, and long-run trends. Understanding these signatures allows you to match the right model to the data without relying on graphing calculator regression alone.
Constant Rate of Change → Linear
Constant Second Differences → Quadratic
Constant Ratio → Exponential
Residual Analysis
End Behavior & Domain Constraints
SECTION 3
Visual Explanation: Comparing Models on One Data Set
The diagram above illustrates a core challenge in model validation: over a restricted domain, multiple function families can approximate the data reasonably well. The linear model (blue dashed line) captures the general upward trend but systematically undershoots on the right side, where the data curves upward more steeply. Both the exponential and quadratic curves hug the data points more tightly, but they diverge from each other outside the observed range. To distinguish between these two, you need to apply the algebraic signature tests—checking whether successive output ratios or successive second differences are approximately constant—and then examine the residuals for systematic patterns.
SECTION 4
Mathematical Framework for Model Selection
The mathematical backbone of model validation consists of difference and ratio tests applied to equally spaced input values. Suppose you have data points (x₁, y₁), (x₂, y₂), …, (xₙ, yₙ) where the x-values are equally spaced with common increment Δx. The following tests let you classify the underlying function.
FIRST DIFFERENCES (LINEAR TEST)
If all Δyₖ are approximately equal, the data is linear. The common difference equals m · Δx, where m is the slope.
SECOND DIFFERENCES (QUADRATIC TEST)
If first differences are not constant but second differences Δ²yₖ are approximately constant, the data is quadratic. The constant second difference equals 2a · (Δx)², where a is the leading coefficient.
CONSECUTIVE RATIOS (EXPONENTIAL TEST)
If all rₖ are approximately equal and positive, the data is exponential. The common ratio equals , where b is the base of f(x) = a · bˣ.
RESIDUAL
After fitting a candidate model, compute residuals for each data point. A good fit produces residuals that are small in magnitude, randomly scattered, and show no systematic pattern when plotted against x.
SECTION 5
Algebraic Signatures of Each Function Family
Each function family leaves a distinctive algebraic fingerprint in equally spaced data. The table below summarizes these signatures alongside the corresponding end behavior and contextual clues that help you narrow down the correct model on the AP exam.
| Model | Form | Data Signature | End Behavior |
|---|---|---|---|
| Linear | f(x) = mx + b | Constant first differences | → ±∞ as x → ±∞ |
| Quadratic | f(x) = ax² + bx + c | Constant second differences | Both ends → +∞ or both → −∞ |
| Exponential | f(x) = a · bˣ (b > 0, b ≠ 1) | Constant consecutive ratios | One end → 0, other → ∞ |
| Logarithmic | f(x) = a + b · ln(x) | Decreasing differences; inputs with constant ratios yield constant output differences | → ∞ slowly as x → ∞; undefined for x ≤ 0 |
Summary of algebraic signatures for the four major AP Precalculus function families
A special note on logarithmic models: because logarithmic and exponential functions are inverses, the logarithmic signature is essentially the exponential test applied to the roles of x and y reversed. If your input values have a constant ratio and the output differences are approximately constant, the data follows a logarithmic pattern. This situation arises naturally in contexts like the Richter scale, decibel measurements, and pH.
SECTION 6
Worked Example: Choosing Between Exponential and Quadratic
Consider the following data set collected from a biological experiment measuring the number of bacteria (in thousands) in a culture over equally spaced time intervals.
| t (hours) | 0 | 1 | 2 | 3 | 4 | 5 |
|---|---|---|---|---|---|---|
| N(t) | 5 | 10 | 20 | 39 | 80 | 158 |
Bacteria population data (thousands)
Worked example
- 1
Step 1 — Compute First Differences
Δy: 10 − 5 = 5, 20 − 10 = 10, 39 − 20 = 19, 80 − 39 = 41, 158 − 80 = 78. The first differences are 5, 10, 19, 41, 78—clearly not constant, so no linear function passes exactly through all six observations.No exact linear fit — first differences vary. - 2
Step 2 — Compute Consecutive Ratios
r: 10/5 = 2.00, 20/10 = 2.00, 39/20 = 1.95, 80/39 ≈ 2.05, 158/80 ≈ 1.975. All ratios are approximately 2.0, suggesting an exponential model with base b ≈ 2.Ratios ≈ 2.0 — strong exponential signal. - 3
Step 3 — Check Second Differences (Competing Test)
Δ²y: 10 − 5 = 5, 19 − 10 = 9, 41 − 19 = 22, 78 − 41 = 37. The second differences are 5, 9, 22, 37—these are not constant, so no quadratic function passes exactly through all six observations.No exact quadratic fit — second differences vary. - 4
Step 4 — Propose an Exponential Model and Examine Residuals
Using N(0) = 5 and the near-constant ratio 2, propose N(t) = 5·2ᵗ. Predictions are 5, 10, 20, 40, 80, 160, with residuals 0, 0, 0, −1, 0, −2. This candidate fits closely over the observed interval, but six small residuals do not establish uniqueness, a patternless error process, or future accuracy. The supplemental curves 5 + 31t and 5 + 6t² are illustrative comparators, not least-squares fits.N(t) = 5·2ᵗ fits closely here; further validation is needed.
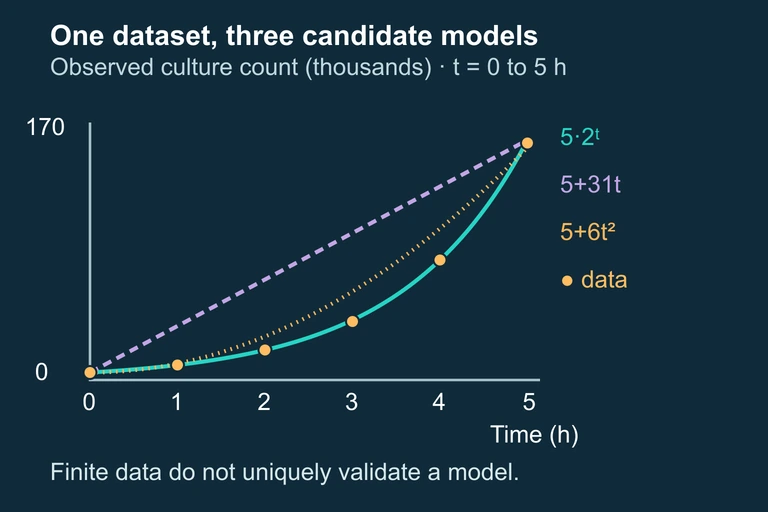 The selected exponential model leaves residuals 0,0,0,−1,0,−2; a few small residuals support comparison but do not prove a model.
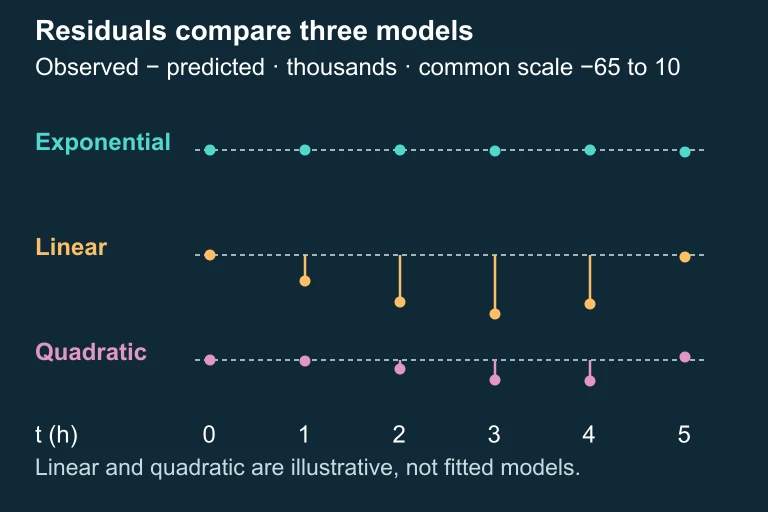 Three residual plots on a common vertical scale. The linear and quadratic curves are illustrative comparisons rather than fitted models.
Key takeaway
 For the six observations 5, 10, 20, 39, 80, and 158 thousand, the model N = 5×2^t gives residuals 0, 0, 0, −1, 0, and −2 thousand.
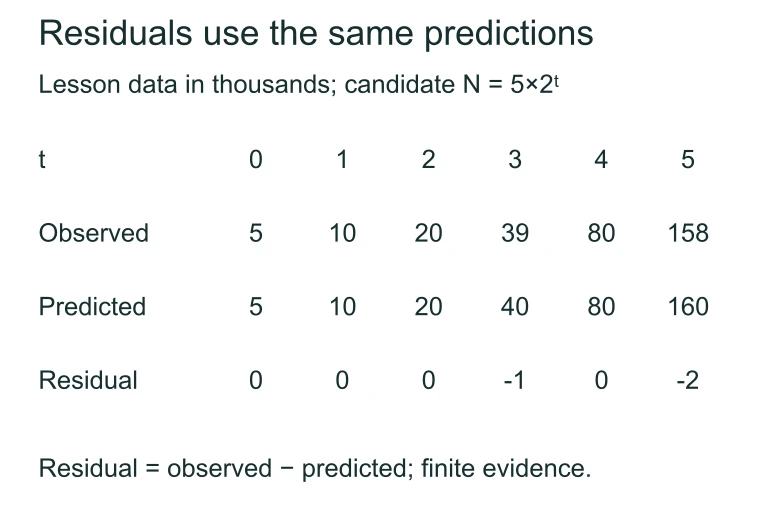 For the six observations 5, 10, 20, 39, 80, and 158 thousand, the model N = 5×2^t gives residuals 0, 0, 0, −1, 0, and −2 thousand.
SECTION 7
Strengths & Limitations of Each Model Type
No single function family is universally superior; each has contexts where it excels and contexts where it fails. The table below compares the four primary AP Precalculus models across several practical dimensions that the exam frequently tests.
| Criterion | Linear | Quadratic | Exponential | Logarithmic |
|---|---|---|---|---|
| Short-term fit | Good over narrow intervals | Good with curvature | Good for growth/decay | Good for rapid-then-slow |
| Extrapolation risk | Moderate (no curvature) | High (unbounded both ends) | Very high (grows to ∞) | Low (slow growth) |
| Domain restrictions | All real numbers | All real numbers | All reals (output > 0 if a > 0) | x > 0 only |
| Common misfit signal | Curved residual plot | Residuals grow at extremes | Overpredicts when growth slows | Underpredicts for large x if growth continues |
Comparison of model types across common validation criteria
Key takeaway
SECTION 8
Connection to Advanced Regression & AP Statistics
The model validation techniques you learn in AP Precalculus form the conceptual bridge to more advanced topics in AP Statistics and college-level data analysis. While Precalculus focuses on algebraic signatures (differences, ratios) and qualitative residual analysis, statistics courses formalize these ideas with numerical diagnostics like the coefficient of determination (R²), information criteria, and hypothesis tests on residuals.
| AP Precalculus Approach | Advanced / AP Statistics Extension |
|---|---|
| Check first differences, second differences, and ratios | Linearize the model (e.g., log-transform) and compute R² for each candidate |
| Visually inspect residual plots for patterns | Run formal residual diagnostics: Durbin-Watson test, runs test for randomness |
| Use context and end behavior to eliminate candidates | Apply Akaike Information Criterion (AIC) to penalize model complexity |
| Fit model by matching initial value and common ratio or slope | Least-squares regression with transformed variables (e.g., ln y vs. x for exponential) |
How Precalculus model validation connects to advanced regression
One powerful technique that bridges both courses is linearization. If you suspect an exponential model y = a · bˣ, taking the natural logarithm of both sides yields ln y = ln a + x · ln b, which is linear in x. If a scatter plot of (x, ln y) is approximately linear, the original data is exponential. This same strategy validates power models (use ln y vs. ln x) and is a cornerstone of AP Statistics regression analysis.
SECTION 9
Practice Problems
Question 1: CONCEPTUAL
- A. Quadratic
- B. Exponential growth
- C. Linear
- D. Logarithmic
- E. Exponential decay
Show answer (C)
Question 2: BASIC CALCULATION
- A. y = 3x + 3
- B. y = 2 · 3ˣ
- C. y = 3 · 3ˣ
- D. y = 3x²
- E. y = 3 · ln(x + 1)
Show answer (C)
Question 3: INTERMEDIATE
- A. The first differences are constant, indicating a linear model.
- B. The consecutive ratios are not approximately constant; the second differences are constant at 4, indicating a quadratic model.
- C. The data has a vertical asymptote, indicating a logarithmic model.
- D. The consecutive ratios equal 2, confirming an exponential model.
- E. The second differences are increasing, so a cubic model is needed.
Show answer (B)
Question 4: APPLIED
Show answer
Question 5: CRITICAL THINKING