AP Microeconomics Quiz
20 questions · no time limit
0:00
SUPPLY AND DEMAND
Question 1 of 20
No time limit
Current
Answered
Flagged
Not seen
Starting from equilibrium in the market graph shown, demand increases (for example, due to higher consumer incomes for a normal good). Which of the following best describes the change from to the new equilibrium? 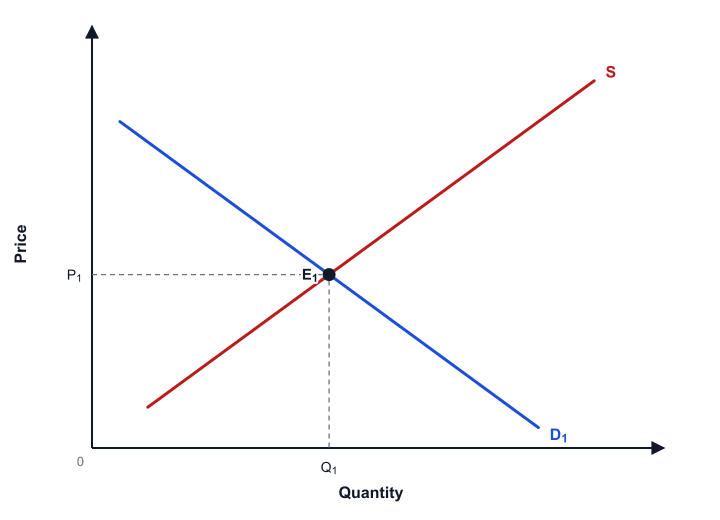
YOUR PROGRESS
20
QUESTIONS
Ready when you are
Answer in any order. Your progress shows here as you go.
QUESTIONS
KEYBOARD
Pick an answer ABCDE
Next question ↵→
Previous ←
Flag for review F