01 / 21

Trophic Levels
Energy Flow in Ecosystems

Explore how energy transfers between organisms, why only \(\approx 10\%\) moves up each level, and how ecological pyramids reveal the structure of every food web.

AP Environmental Science

What Are Trophic Levels?

A trophic level describes the position an organism occupies in a food chain: how many energy transfers separate it from the original source of energy. Every ecosystem is organized into these feeding layers, from the organisms that capture sunlight to the top predators.

Feeding Levels and Decomposers

1
Producers (Autotrophs): Plants, algae, and cyanobacteria that convert solar energy into chemical energy via photosynthesis.
2
Primary Consumers (Herbivores): Organisms like rabbits, deer, and zooplankton that eat producers directly.
3
Secondary Consumers: Carnivores and omnivores (e.g., frogs, small fish) that feed on primary consumers.
4
Tertiary Consumers: Top-level predators such as hawks, sharks, and wolves.
5
Decomposers: Bacteria and fungi that break down dead matter at every level, recycling nutrients back into the soil.

Explain why trophic position need not be an integer.

Use this illustration to explore the concept described in its caption.
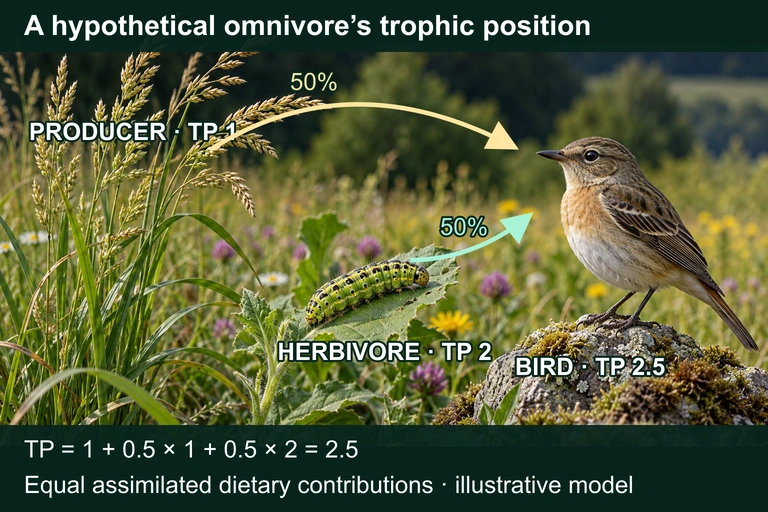
A seed plant and leaf-eating caterpillar each feed a hypothetical bird in a simplified model, with 50 percent dietary contribution from each. Producer TP 1 and herbivore TP 2 yield bird TP 2.5.
A hypothetical bird obtaining equal assimilated dietary contributions from producers and herbivores has trophic position 2.5 in this simplified model. The fractions describe dietary contributions rather than equal numbers of food items; the image does not assert this particular bird species’ diet.

Four feeding positions along one path
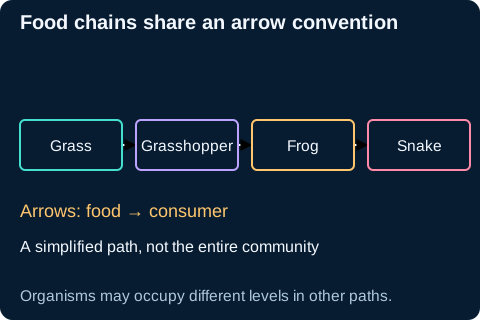
Arrows connect grass to grasshopper to frog to snake, pointing from food to consumer.Energy passes from grass to grasshopper to frog to snake. Along this feeding path, these organisms occupy the producer, primary-consumer, secondary-consumer and tertiary-consumer levels; arrows point from food to consumer.Open full diagram

Visualizing the Energy Pyramid

Tertiary Consumers Secondary Consumers Primary Consumers Producers 1 kcal 10 kcal 100 kcal 1,000 kcal Energy flow ★

The 10% Rule of Energy Transfer

On average, only about \(10\%\) of the energy at one trophic level is passed to the next. The remaining \(\approx 90\%\) is lost as metabolic heat (cellular respiration), used for life processes, or remains in indigestible material.

Where Does the 90% Go?

Energy Consumed ~60% Lost as Heat (Cellular Respiration) ~30% Lost as Waste (Indigestible Material) ~10% Stored (Available to next level)

Food Chain vs Food Web

Food Chain
A single linear pathway showing one route of energy transfer. Example: Grass → Rabbit → Fox → Eagle. Simple but unrealistic: organisms rarely eat just one thing.
Food Web
An interconnected network of multiple food chains in an ecosystem. Shows the true complexity of feeding relationships and explains why removing one species can cascade through many others.

An otter’s feeding link changes an entire underwater forest
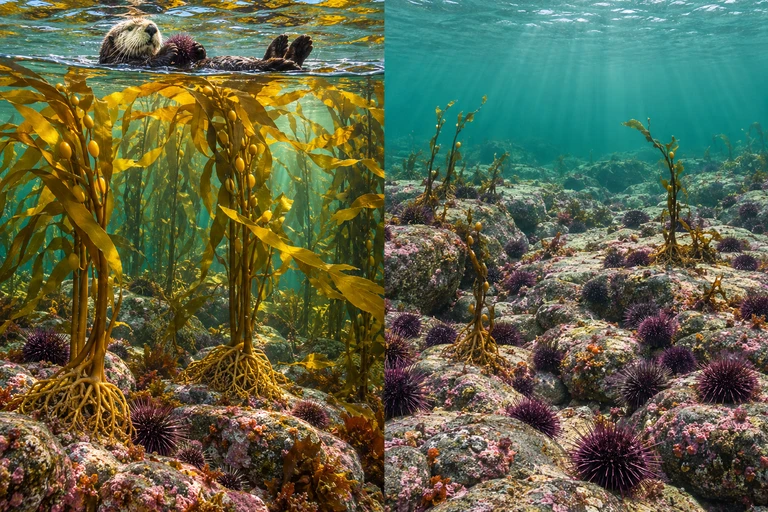
An otter floats above a lush kelp forest beside a conceptual urchin-dominated rocky state with sparse kelp.In this kelp–urchin–otter food web, otter feeding can limit urchin grazing and indirectly favor kelp. Other environmental conditions and interactions also influence kelp-forest outcomes.

Direct feeding can cause indirect effects
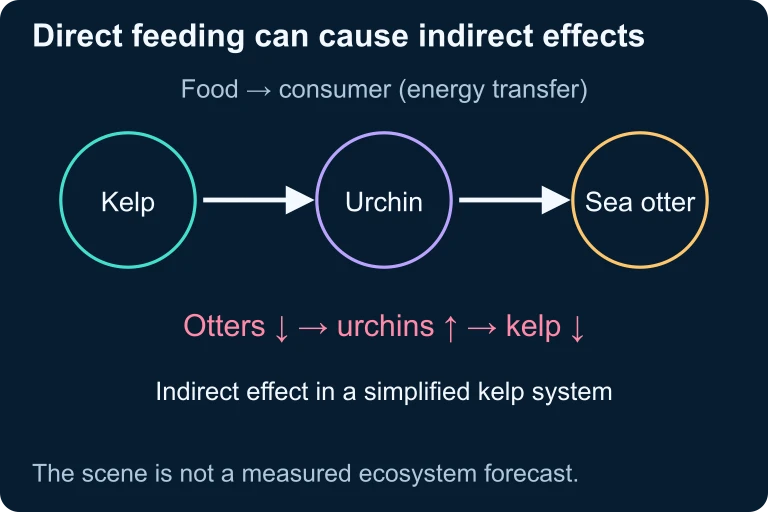
Direct feeding can cause indirect effects. In this kelp–urchin–otter food web, otter feeding can limit urchin grazing and indirectly favor kelp. Other environmental conditions and interactions also influence kelp-forest outcomes.In this kelp–urchin–otter food web, otter feeding can limit urchin grazing and indirectly favor kelp. Other environmental conditions and interactions also influence kelp-forest outcomes.

GPP vs NPP

Gross Primary Productivity
The total amount of energy fixed by producers through photosynthesis per unit area per unit time.
Net Primary Productivity
The energy remaining after producers use some for their own respiration. This is the energy available to consumers.

How to Analyze Trophic Levels

1
Identify the producers: Find the organisms that make their own food (plants, algae, phytoplankton).
2
Trace the energy flow: Follow the arrows in the food chain or food web from producer → consumer → consumer.
3
Assign trophic levels: Count the number of energy transfers from the producer. Producers = Level 1, herbivores = Level 2, and so on.
4
Apply the 10% rule: Multiply the starting energy by \(0.10\) for each level to determine available energy at any trophic level.
5
Watch for omnivores: Organisms that eat from multiple trophic levels occupy more than one level simultaneously.

Example 1: Simple Energy Calculation

A grassland ecosystem has producers that fix \(20{,}000\) kcal/m²/year of energy. How much energy is available to secondary consumers?

Producers 20,000 kcal Primary 2,000 kcal Secondary 200 kcal Tertiary 20 kcal ×0.10 ×0.10 ×0.10 Answer: 200 kcal/m²/year 20,000 × (0.10)² = 200

Example 2: Working Backward

A top predator (tertiary consumer) needs \(50\) kcal/day. How much energy must the producers fix to support this predator?

1
Identify the gap: Tertiary consumer is 3 transfers from producers.
2
Reverse the 10% rule: Divide by \(0.10\) for each level (or multiply by 10).
3
Calculate: \( 50 \div (0.10)^3 = 50 \times 1{,}000 = \) \(50{,}000\) kcal/day from producers.

Example 3: Calculating NPP

An ocean ecosystem has a GPP of \(8{,}000\) kcal/m²/year. Phytoplankton use \(3{,}200\) kcal for their own respiration. What is the NPP, and how much energy reaches secondary consumers?

1
Find NPP: \( \text{NPP} = 8{,}000 - 3{,}200 = \) \(4{,}800\) kcal/m²/year
2
Primary consumers: \( 4{,}800 \times 0.10 = \) \(480\) kcal
3
Secondary consumers: \( 480 \times 0.10 = \) \(48\) kcal/m²/year

Three Types of Ecological Pyramids

Energy Pyramid
Always upright. Shows kcal at each level. Cannot be inverted because energy is always lost going up.
Biomass Pyramid
Usually upright. Shows mass of organisms. Can be inverted in aquatic ecosystems where tiny phytoplankton reproduce rapidly.
Numbers Pyramid
Can be inverted. Counts individuals. A single tree (producer) can support thousands of insects.

Bioaccumulation & Biomagnification

Bioaccumulation
Toxins build up within a single organism over its lifetime because they are absorbed faster than they can be metabolized or excreted.
Biomagnification
Toxin concentrations increase at each trophic level. Top predators accumulate the highest doses: DDT in bald eagles is a classic example.

Common Mistakes

✕ Using GPP Instead of NPP
Energy available to consumers starts at NPP. You must subtract the producers' respiration before applying the 10% rule.
✕ Forgetting Decomposers
Decomposers operate at every trophic level, not just at the bottom. They recycle nutrients, not energy.
✕ Assuming Pyramids Are Always Upright
Only energy pyramids are always upright. Biomass and numbers pyramids can be inverted in certain ecosystems.

Trophic Level Summary Table

Trophic Level Examples Energy (Relative) Toxin Concentration
1: Producers Grass, algae, oak tree 10,000 kcal Lowest
2: Primary Consumers Rabbit, zooplankton, deer 1,000 kcal Low
3: Secondary Consumers Frog, small fish, snake 100 kcal Moderate
4: Tertiary Consumers Hawk, shark, wolf 10 kcal Highest

Question 1 of 5

If a grassland ecosystem's producers fix \(50{,}000\) kcal/m²/year, approximately how much energy is available to tertiary consumers?

Question 2 of 5

Which type of ecological pyramid can never be inverted?

Question 3 of 5

An ecosystem has a GPP of \(12{,}000\) kcal/m²/year and the producers' respiration is \(4{,}000\) kcal. What is the NPP?

Question 4 of 5

DDT concentration is highest in which organism within a marine food chain: phytoplankton → zooplankton → small fish → tuna → dolphin?

Question 5 of 5

A bear eats both berries (producer) and salmon (secondary consumer). At which trophic levels does the bear operate?