01 / 21

The Green
Revolution

Explore how high-yield crops, synthetic fertilizers, and irrigation technology transformed global agriculture and reshaped our environment.

AP Environmental Science

What Was the Green Revolution?

The Green Revolution refers to the period from the 1940s to the 1970s when a series of research, development, and technology transfer initiatives dramatically increased agricultural production worldwide, particularly in developing nations.

Key Innovations of the Green Revolution

★ High-Yield Varieties
Selectively bred dwarf wheat and rice strains that produced dramatically more grain per plant
★ Synthetic Fertilizers
Nitrogen, phosphorus, and potassium (NPK) fertilizers boosted soil nutrient availability
★ Irrigation Systems
Mechanized pumps and canal networks provided reliable water access to farmlands

Semi-dwarf varieties alter biomass allocation and lodging resistance
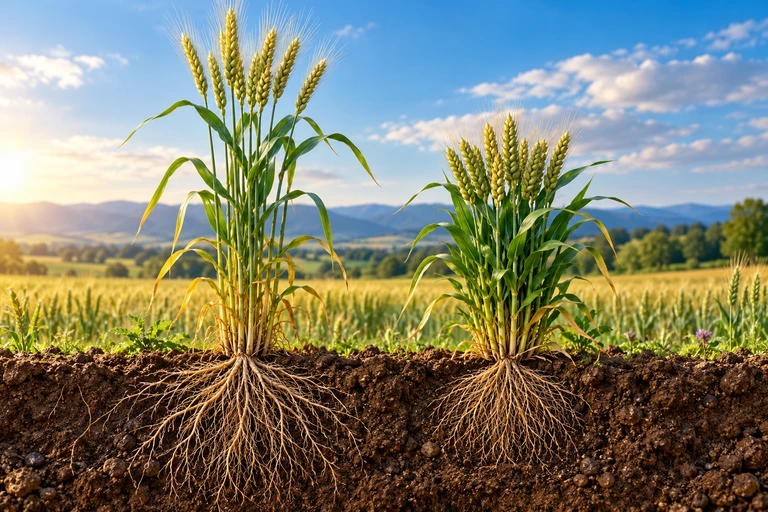
Matched tall and semi-dwarf cereal plants with conceptual root cutaways under the same field conditions.With 10 g of aboveground dry biomass, 3 g versus 5 g of grain gives harvest indices of 0.30 and 0.50. At the same 1 N horizontal tip load, heights of 1.2 m and 0.8 m give base moments of 1.2 and 0.8 N·m; actual lodging also depends on stem strength, anchorage and growing conditions.

Harvest index tracks grain fraction, not height
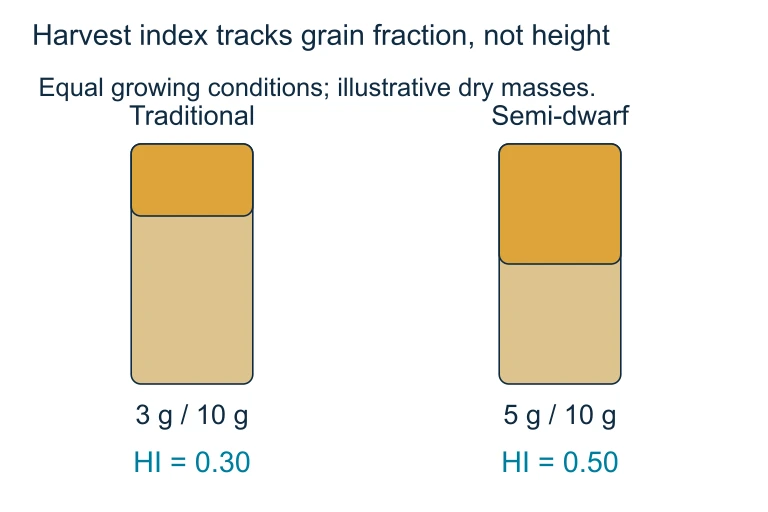
Harvest index tracks grain fraction, not height. With 10 g of aboveground dry biomass, 3 g versus 5 g of grain gives harvest indices of 0.30 and 0.50. At the same 1 N horizontal tip load, heights of 1.2 m and 0.8 m give base moments of 1.2 and 0.8 N·m; actual lodging also depends on stem strength, anchorage and growing conditions.With 10 g of aboveground dry biomass, 3 g versus 5 g of grain gives harvest indices of 0.30 and 0.50. At the same 1 N horizontal tip load, heights of 1.2 m and 0.8 m give base moments of 1.2 and 0.8 N·m; actual lodging also depends on stem strength, anchorage and growing conditions.

Height and a simplified lodging load
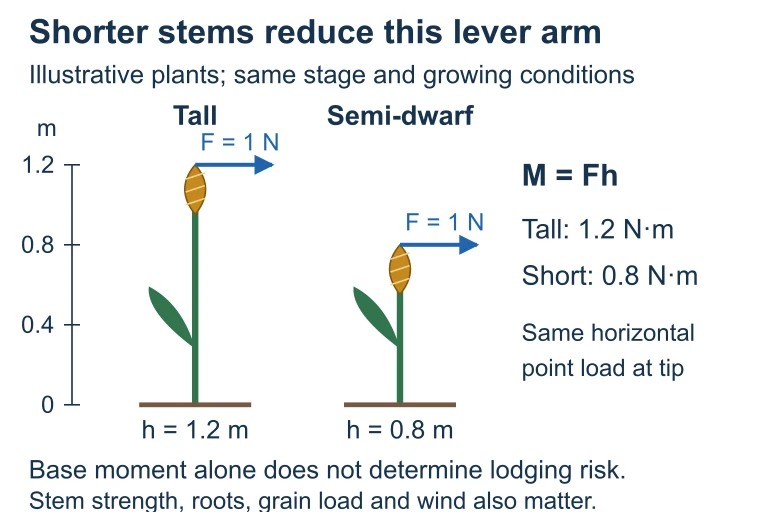
Height and a simplified lodging load. At the same 1 N horizontal tip load, 1.2 m and 0.8 m plants have base moments of 1.2 and 0.8 N·m. Stem strength, root anchorage and soil conditions also affect lodging.At the same 1 N horizontal tip load, 1.2 m and 0.8 m plants have base moments of 1.2 and 0.8 N·m. Stem strength, root anchorage and soil conditions also affect lodging.

Global Spread and Timeline

1940s 1950s 1960s 1970s 1980s Mexico India Philippines Latin Am. & Africa Yield

Starting in Mexico in the 1940s, the Green Revolution spread to India and the Philippines in the 1960s, then to Latin America and parts of Africa in the 1970s, dramatically raising global cereal production.

The Core Equation

INPUTS HYV Seeds Fertilizer + Water Pesticides MONOCULTURE Mechanized farming Single-crop fields Large-scale ops OUTPUTS Higher yields Lower food prices More calories/acre

Dramatic Yield Increases

Yield (tonnes/hectare) 0 1 2 3 4 5 1950 1960 1970 1980 Wheat Rice Corn Green Rev. Peak

Global cereal yields roughly doubled or tripled between 1950 and 1980, with corn seeing the steepest gains due to hybrid varieties, followed by wheat and rice.

Benefits vs. Costs

Benefits Environmental Costs
Food Supply Increased caloric output Monoculture vulnerability
Economics Lower food prices Small farmers displaced
Soil Short-term fertility boost Long-term degradation
Water Irrigation infrastructure Aquifer depletion
Biodiversity Saved wild land from farming Genetic diversity loss

Compare output gain with input and economic dependence.

Use this illustration to explore the concept described in its caption.
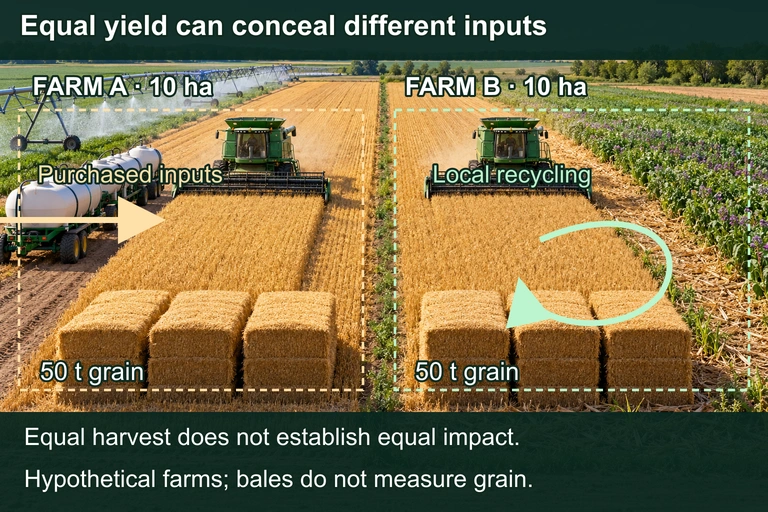
Two hypothetical field boundaries each indicate ten hectares and fifty tonnes of grain. A purchased input crosses the first boundary; a recycling arrow remains within the second. The bales do not measure grain.
Both hypothetical farms produce 50 t of harvested grain on 10 ha, but their input pathways differ. Both may use additional inputs. The pictured bales and residue do not measure grain output. Equal yield alone does not establish equal environmental impact, profitability or resilience.

Environmental Impacts

1
Soil Degradation: Heavy fertilizer use depleted organic matter and disrupted microbial communities, leading to compaction and erosion.
2
Water Pollution: Nitrogen and phosphorus runoff caused eutrophication, creating algal blooms and aquatic dead zones.
3
Biodiversity Loss: Monocultures replaced diverse crop varieties, and pesticide use harmed non-target species including pollinators.
4
Aquifer Depletion: Intensive irrigation drew down groundwater faster than natural recharge, especially in India's Punjab region.

Irrigation salt balance depends on evaporation, drainage and leaching
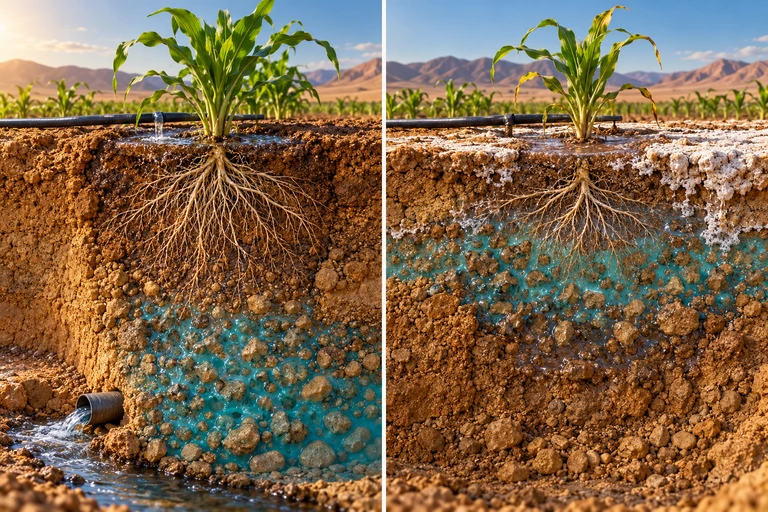
Matched crop root zones contrast deeper drainage with a shallow water table and surface salts. The exact model distinguishes water-only evaporation from salt-bearing irrigation, capillary rise and drainage.Irrigation imports dissolved salts. Evaporation and transpiration can concentrate them, and capillary rise can add salts from shallow groundwater. Adequate leaching and drainage can export salts.

Root-zone salt balance
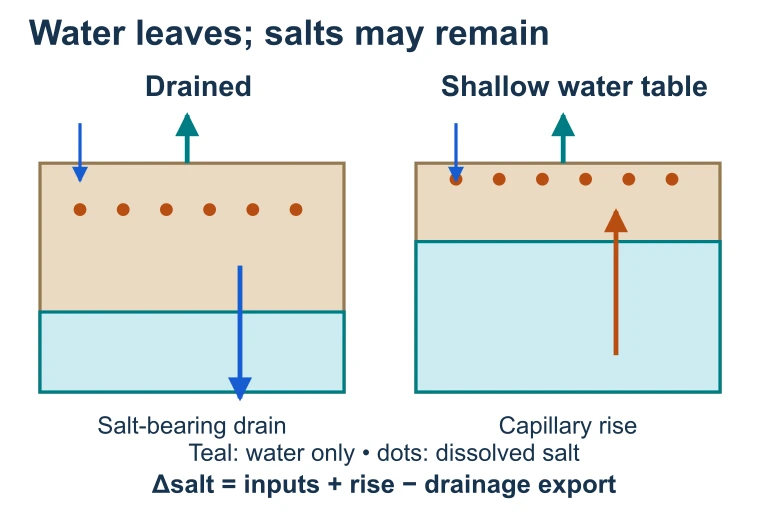
Root-zone salt balance. Irrigation imports dissolved salts. Evaporation and transpiration can concentrate them, and capillary rise can add salts from shallow groundwater. Adequate leaching and drainage can export salts.Irrigation imports dissolved salts. Evaporation and transpiration can concentrate them, and capillary rise can add salts from shallow groundwater. Adequate leaching and drainage can export salts.

How Eutrophication Works

1. Fertilizer
\( \text{N} + \text{P} \) applied
2. Runoff
Rain carries \( \text{N/P} \)
3. Algal Bloom Algae explode 4. Die-off Algae decompose 5. Hypoxia Oxygen depleted "Dead Zone" Aquatic Ecosystem Algae overgrowth
Low dissolved \( \text{O}_2 \)
Fish die-off

Social Consequences

✓ Famine Reduction
India went from famine-prone to a net food exporter within two decades
✕ Inequality
Wealthy landowners benefited most; small farmers couldn't afford inputs and were displaced
✓ Population Growth
Supported feeding a global population that grew from 2.5 to 4.5 billion during this era
✕ Dependency
Farmers became reliant on purchased seeds, fertilizers, and pesticides from corporations

Monoculture vs. Polyculture

Monoculture Polyculture
Definition Single crop over large area Multiple crops grown together
Yield per crop High Moderate per species
Pest vulnerability Very high Low (natural pest control)
Soil health Degrades over time Maintained/improved
Biodiversity Very low High
Input costs High (fertilizer, pesticide) Low (natural cycling)

How to Analyze Agricultural Impact

1
Identify the practice: Is it monoculture, polyculture, organic, conventional, or industrial?
2
Trace the inputs: What seeds, water, chemicals, and energy does it require?
3
Map the outputs: Yield, waste, runoff, greenhouse gases, and economic products.
4
Assess externalities: What are the hidden environmental and social costs not reflected in market prices?
5
Evaluate sustainability: Can this practice continue indefinitely without degrading its resource base?

Case Study: India's Punjab

India's Punjab region became the showcase of the Green Revolution. Wheat yields tripled between 1965 and 1980, making India self-sufficient in food. However, the long-term consequences were severe.

✓ Wheat output tripled
From \( \approx 1.1 \) to \( 3.4 \) tonnes/hectare by 1980
✕ Water table dropped
Groundwater fell by 0.3 m/year due to tube well irrigation
✕ Soil salinization
Waterlogging and evaporation left salt deposits in topsoil

Case Study: Mexico's Wheat

Norman Borlaug's work in Mexico developed semi-dwarf, high-yield wheat varieties that resisted stem rust disease. By 1963, Mexico became a net wheat exporter.

Traditional Wheat Tall stem Falls over in wind HYV Dwarf Wheat Short, strong stem Larger grain head vs.

Common Mistakes

✕ All Positive
Treating the Green Revolution as purely beneficial. It had serious environmental and social costs that must be addressed on the APES exam.
✕ GMO Confusion
Confusing Green Revolution crops (selective breeding) with modern GMOs (genetic engineering). They are different technologies.
✕ Africa Included
Assuming the Green Revolution succeeded equally everywhere. Sub-Saharan Africa largely missed the benefits due to different soil types and infrastructure gaps.

Key Takeaways

1
High-yield varieties + synthetic inputs + irrigation = the three pillars of the Green Revolution.
2
It saved billions from famine but caused soil degradation, water pollution, biodiversity loss, and social inequality.
3
Monoculture increases short-term yield but decreases long-term resilience compared to polyculture.
4
Eutrophication (nutrient runoff causing algal blooms and dead zones) is a key environmental consequence to know.
5
Sustainable agriculture (organic farming, IPM, polyculture) represents the modern alternative approach.

Question 1 of 5

Which of the following was NOT a primary component of the Green Revolution?

Question 2 of 5

Eutrophication caused by agricultural runoff leads to aquatic dead zones primarily because:

Question 3 of 5

A researcher finds that a region using Green Revolution techniques for 40 years has experienced declining yields despite constant fertilizer input. Which is the most likely explanation?

Question 4 of 5

Which statement best describes why the Green Revolution had limited success in Sub-Saharan Africa?

Question 5 of 5

Compared to monoculture, polyculture agricultural systems are generally characterized by: