01 / 22

Soil Composition
and Properties

Explore what makes up soil, how texture, porosity, and organic content determine ecosystem health and agricultural productivity.

AP Environmental Science

What Is Soil?

Soil is a complex mixture of minerals, organic matter, water, and air that forms at the Earth's surface. It develops over centuries through the weathering of rock and the decomposition of living organisms.

The Four Components of Soil

45% Minerals 25% Water 25% Air 5% Organic Matter

Why Soil Matters

★ Food Production
95% of the world's food is grown in soil. Nutrient cycling in soil feeds plants.
★ Water Filtration
Soil filters groundwater, removing contaminants as water percolates through layers.
★ Carbon Storage
Soil stores more carbon than the atmosphere and all plant life combined.

Soil Horizons: The Soil Profile

O Horizon Organic litter (leaves, debris) A Horizon (Topsoil) Humus-rich, dark, fertile E Horizon Leached / eluviation B Horizon (Subsoil) Accumulated minerals, clay C Horizon Weathered parent material R Horizon (Bedrock) Unweathered rock Increasing Depth

Soil horizons reflect additions,translocation and weathering
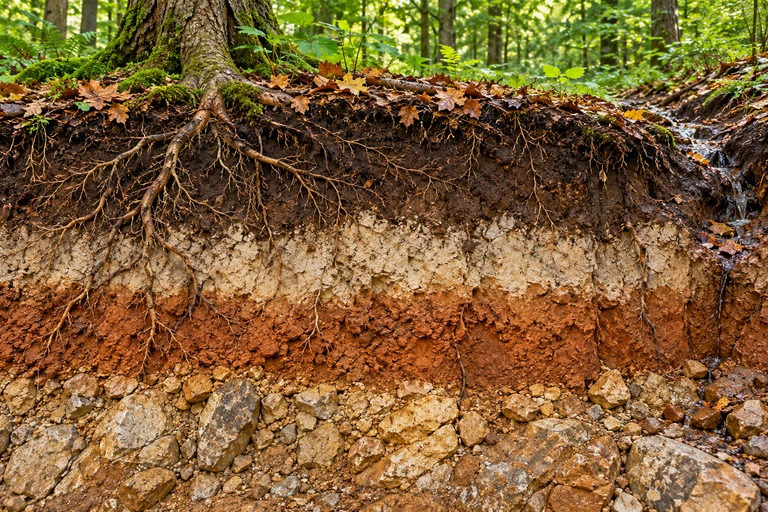
A forest soil cutaway with roots and litter accompanies authored O,A,E,B,C horizon bands and a downward translocation arrow.Soil horizons reflect litter inputs, mixing, upper-horizon export and deeper accumulation. Dissolved leaching differs from suspended-clay translocation; profile depth and fertility depend on more than age.

Soil profiles reflect additions,transfers and transformations.
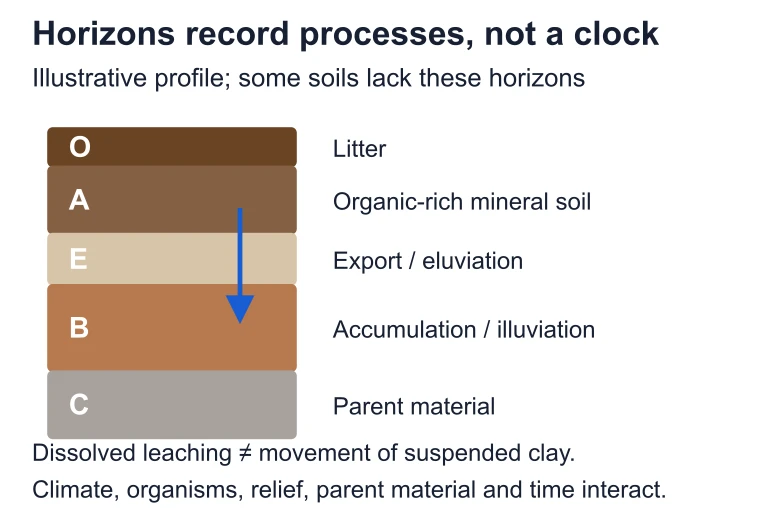
Soil profiles reflect additions,transfers and transformations.. Soil horizons reflect litter inputs, mixing, upper-horizon export and deeper accumulation. Dissolved leaching differs from suspended-clay translocation; profile depth and fertility depend on more than age.Soil horizons reflect litter inputs, mixing, upper-horizon export and deeper accumulation. Dissolved leaching differs from suspended-clay translocation; profile depth and fertility depend on more than age.

Soil Texture: Sand, Silt, and Clay

Sand
Largest particles (0.05–2 mm). Gritty feel, drains quickly, low nutrient retention.
Silt
Medium particles (0.002–0.05 mm). Smooth feel, moderate drainage and nutrients.
Clay
Smallest particles (< 0.002 mm). Sticky, high nutrient holding, poor drainage.

Explain why texture classification does not fully predict field permeability.

Use this illustration to explore the concept described in its caption.
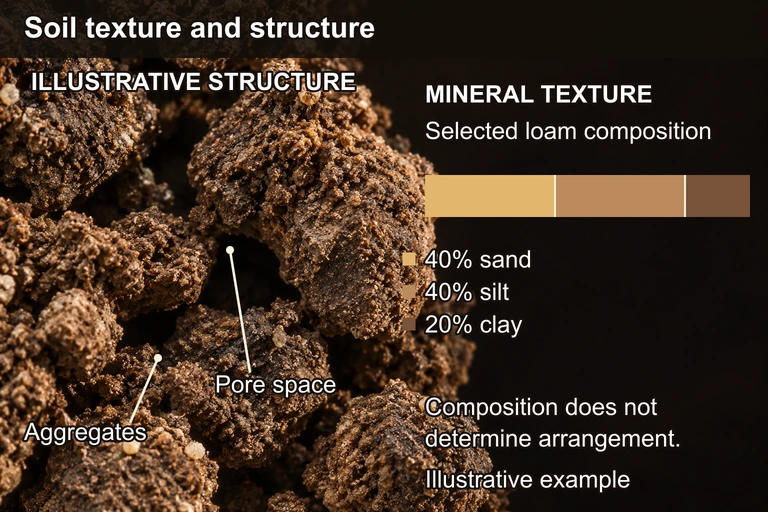
A close-up of soil aggregates marks a clump and pore space. A separate mineral-fraction bar shows 40 percent sand, 40 percent silt and 20 percent clay.
The illustrative mineral fraction contains 40% sand, 40% silt and 20% clay, a loam composition. The bar shows those proportions; the separate aggregate image illustrates clumps and pore spaces. Texture alone does not establish field arrangement or permeability. Separate illustrative sample: 40% sand, 40% silt, 20% clay (loam). The worked example uses 30% sand, 50% silt, 20% clay (silt loam).

Porosity vs. Permeability

Sand Large pores High permeability Clay Tiny pores Low permeability Porosity % of soil that is pore space Permeability Rate water moves through

Porosity and Permeability Compared

Porosity Permeability
Definition Total pore space in soil How easily water flows through
Sand Low (~35%) High
Clay High (~55%) Low
Depends on Particle packing Pore size and connectivity
Key Insight More space ≠ more flow Large, connected pores = fast flow

Soil pore geometry links texture,structure,water and air
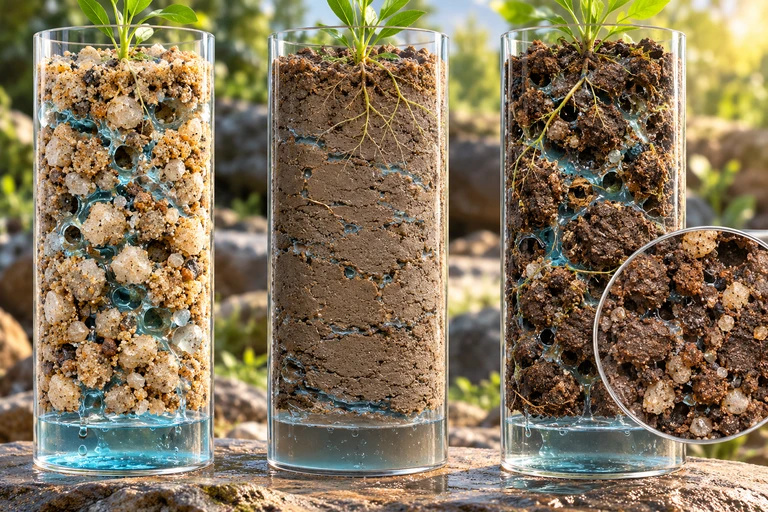
Illustrative sand-rich, clay-rich and loam soil columns accompany a separate equal-area model of wider and narrower pore throats. The exact comparison holds modeled void fraction fixed; it does not depict compaction.The same pore-area fraction can accompany different widths of connecting pore throats. Porosity and permeability therefore measure different properties, and some water held in very small pores is difficult for roots to extract.

Equal modeled void fraction does not imply equal pore-throat geometry.
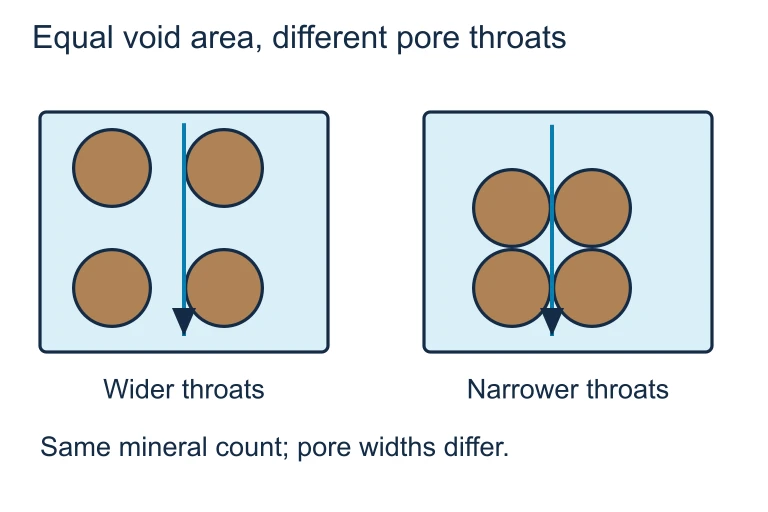
Equal modeled void fraction does not imply equal pore-throat geometry.. The same pore-area fraction can accompany different widths of connecting pore throats. Porosity and permeability therefore measure different properties, and some water held in very small pores is difficult for roots to extract.The same pore-area fraction can accompany different widths of connecting pore throats. Porosity and permeability therefore measure different properties, and some water held in very small pores is difficult for roots to extract.

Soil Formation: CLORPT

Five factors control soil development, remembered by the acronym CLORPT:

Cl
Climate: Temperature and precipitation drive weathering rates and organic decomposition.
O
Organisms: Plants, animals, fungi, and bacteria add organic matter and mix soil.
R
Relief (topography): Slope angle affects drainage, erosion, and soil depth.
P
Parent material: The underlying rock or sediment determines mineral composition.
T
Time: Older soils tend to be deeper and more developed, with distinct horizons.

How to Analyze a Soil Sample

1
Observe color: Dark = high organic content. Red/yellow = iron oxides. Grey = waterlogged.
2
Test texture: Rub between fingers: gritty (sand), smooth (silt), sticky (clay).
3
Measure pH: Use a probe or litmus. Most crops prefer pH 6.0–7.0.
4
Assess drainage: Pour water and time how fast it percolates. Fast = sandy, slow = clay.
5
Identify horizons: Dig a profile and note layers: color transitions mark horizon boundaries.

Cation Exchange Capacity (CEC)

CEC measures a soil's ability to hold and release positively charged nutrient ions (cations) such as \( \text{Ca}^{2+} \), \( \text{Mg}^{2+} \), \( \text{K}^{+} \), and \( \text{NH}_4^{+} \). It is expressed in milliequivalents per 100 g of soil (\( \text{meq}/100\text{g} \)).

Clay
CEC: \( 20\text{–}50 \, \text{meq}/100\text{g} \). High surface area traps many cations.
Sand
CEC: \( 1\text{–}5 \, \text{meq}/100\text{g} \). Large particles have minimal surface charge.
Humus
CEC: \( 100\text{–}300 \, \text{meq}/100\text{g} \). Organic matter is the most effective cation holder.

A soil pore becomes a reversible ion-exchange landscape
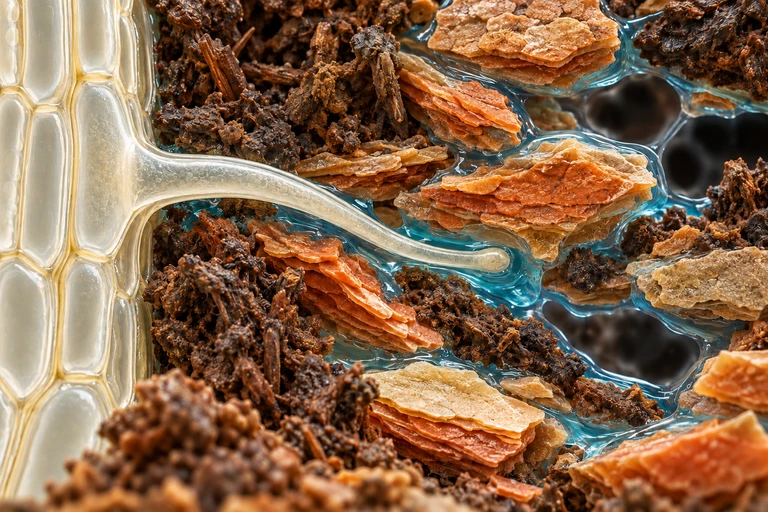
A pale root hair remains continuous with the root epidermis as it extends into cyan water films between layered mineral particles and dark soil organic material; separate air voids are visible.Soil surfaces can reversibly exchange counterions. One adsorbed Ca²⁺ exchanges with two H⁺ while conserving two negative surface sites, one calcium ion and two protons. The dashed surface associations represent electrostatic association.

Reversible cation exchange at a soil surface
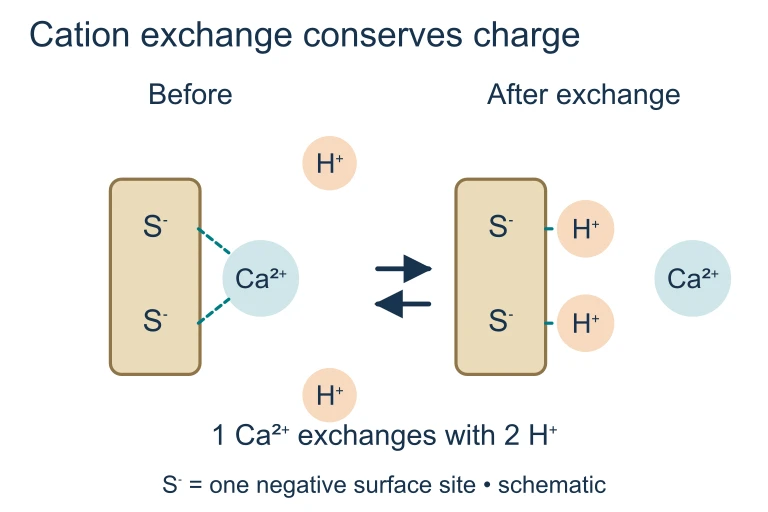
Reversible cation exchange at a soil surface. Soil surfaces can reversibly exchange counterions. One adsorbed Ca²⁺ exchanges with two H⁺ while conserving two negative surface sites, one calcium ion and two protons. The dashed surface associations represent electrostatic association.Soil surfaces can reversibly exchange counterions. One adsorbed Ca²⁺ exchanges with two H⁺ while conserving two negative surface sites, one calcium ion and two protons. The dashed surface associations represent electrostatic association.

Soil pH and Nutrient Availability

Acidic Neutral Alkaline 3 4 5 6 7 8 9 10 Optimal: 6.0–7.0 N, P, K Ca, Mg Fe, Mn Al toxicity Shaded regions = higher availability

Example 1: Identifying Soil Type

A farmer collects a soil sample that feels smooth when rubbed, holds together when moist but crumbles easily when dry. Water drains at a moderate rate. What type of soil is this?

1
Smooth feel rules out sand (gritty) and suggests a high silt content.
2
Crumbles when dry means it is not heavy clay (clay remains in firm clumps).
3
Moderate drainage confirms a mix: not too fast (sand) or too slow (clay).

Example 2: Calculating Porosity

A soil sample has a total volume of \( 200 \, \text{cm}^3 \). When dried, the solid particles occupy \( 110 \, \text{cm}^3 \). What is the porosity?

1
Pore volume: \( 200 - 110 = 90 \, \text{cm}^3 \)
2
Porosity: \( \dfrac{90}{200} \times 100\% = 45\% \)

Example 3: Soil Degradation

A region experiences intensive monoculture farming for 30 years without cover crops or crop rotation. Predict the changes to the soil.

✕ Organic Matter
Decreases sharply: no diverse root systems or residues returned to soil.
✕ CEC
Drops as humus declines: soil holds fewer nutrients, requiring more fertilizer.
✕ Structure
Compaction and erosion: loss of aggregates leads to poor drainage and runoff.

Common Mistakes

✕ Confusing Porosity and Permeability
Clay has high porosity but low permeability. These are independent properties.
✕ Ignoring Organic Matter
Students forget that humus has the highest CEC and is critical for fertility, not just mineral content.
✕ Mixing Up Horizons
The A horizon (topsoil) is humus-rich; the B horizon (subsoil) accumulates leached minerals: they are not the same.

Summary: Soil Properties at a Glance

Property Sand Silt Clay
Particle Size Largest Medium Smallest
Porosity ~35% ~45% ~55%
Permeability High Moderate Low
CEC Low Moderate High
Water Retention Low Moderate High
Best For Drainage General farming Nutrient storage

Question 1 of 5

Which soil component has the highest cation exchange capacity (CEC)?

Question 2 of 5

A soil sample has a total volume of \( 500 \, \text{cm}^3 \) and a solid volume of \( 300 \, \text{cm}^3 \). What is the porosity?

Question 3 of 5

Which soil horizon is the most fertile and contains the highest concentration of organic matter?

Question 4 of 5

Clay has higher porosity than sand, yet water drains more slowly through clay. Which statement best explains this?

Question 5 of 5

Which of the following is NOT one of the five soil formation factors (CLORPT)?