01 / 20

r-Selected and
K-Selected Species

Explore how organisms invest energy in reproduction versus survival, and learn the ecological trade-offs that shape every population on Earth.

AP Environmental Science

What Are Life History Strategies?

Every organism faces a fundamental trade-off: how to allocate limited energy between reproduction and individual survival. Life history strategies describe the patterns that evolve in response to these trade-offs.

Ecologists classify most species along a continuum between two extremes: r-selected (maximize reproduction) and K-selected (maximize survival per offspring).

Defining \( r \) and \( K \)

\( r \) : Intrinsic Growth Rate
The maximum per-capita rate of population increase: \( r = \text{births} - \text{deaths} \). r-selected species evolve to maximize this value.
\( K \) : Carrying Capacity
The maximum population size an environment can sustain long-term. K-selected species evolve to compete effectively near this limit.

Why Does This Matter?

1
Conservation biology: K-selected species (elephants, whales) recover slowly from population decline and are more vulnerable to extinction.
2
Agriculture and pest control: r-selected pests (insects, weeds) can explode in number rapidly, requiring integrated management strategies.
3
Ecosystem stability: Understanding strategy mixes helps predict how communities respond to disturbance, climate change, and resource shifts.
4
Invasive species: Most successful invaders are r-selected: they colonize disturbed habitats quickly and outcompete natives.

Traits of r-Selected Species

Many Offspring
Produce large numbers of small offspring per reproductive event.
Little Parental Care
Energy goes into quantity, not nurturing. Most offspring fend for themselves.
Early Maturity
Reproduce at a young age: short generation time maximizes \( r \).

Traits of K-Selected Species

Few Offspring
Produce a small number of large, well-developed offspring per event.
Extensive Parental Care
Heavy investment in each offspring increases survival probability.
Late Maturity
Longer development time: organisms grow large and competitive before reproducing.

Population Growth Curves

Time Population Size K r-selected K-selected 0

Survivorship Curves

Age (% of max lifespan) Survivors (log scale) Type I (K-selected) Type II (intermediate) Type III (r-selected)

The Core Trade-Off

r-selected Many small offspring Low survival each K-selected Few large offspring High survival each Continuum

Most species are not purely r-selected or K-selected. They fall somewhere along a continuum. For example, sea turtles produce hundreds of eggs (r-trait) but have long lifespans (K-trait). The classification is a useful model, not a rigid binary.

r vs. K: Side by Side

Trait r-Selected K-Selected
Offspring Number Many Few
Offspring Size Small Large
Parental Care Little or none Extensive
Maturation Early / rapid Late / slow
Lifespan Short Long
Population Growth Boom-and-bust Logistic (S-curve)
Survivorship Curve Type III Type I
Typical Habitat Unstable / disturbed Stable / competitive

How to Classify a Species

1
Count offspring per reproductive event. Hundreds or thousands suggests r-selection; one to a handful suggests K-selection.
2
Assess parental investment. Does the parent guard, feed, or teach offspring? High care = K-selected.
3
Measure time to maturity. Weeks or months = r. Years or decades = K.
4
Examine habitat stability. Pioneer or disturbed habitats favor r; stable climax communities favor K.
5
Consider body size. Smaller organisms tend toward r-selection; larger ones toward K. (This is a guideline, not a rule.)

Example: Dandelion

2,000+ seeds per plant Wind-dispersed No parental care Rapid maturation

Example: African Elephant

1 calf per 4-5 years 22-month gestation Extensive parental care Maturity at 10-15 years Lifespan: 60-70 years

Example: Sea Turtle (On the Continuum)

r-Traits
Lay 80-120 eggs per nest, up to 7 nests per season. No parental care after laying. Very high hatchling mortality (>95%).
K-Traits
30-50 year lifespan. Slow maturation (20-30 years to reproduce). Large body size. Few predators as adults.

An oak and a nesting bird reveal mixed life-history traits
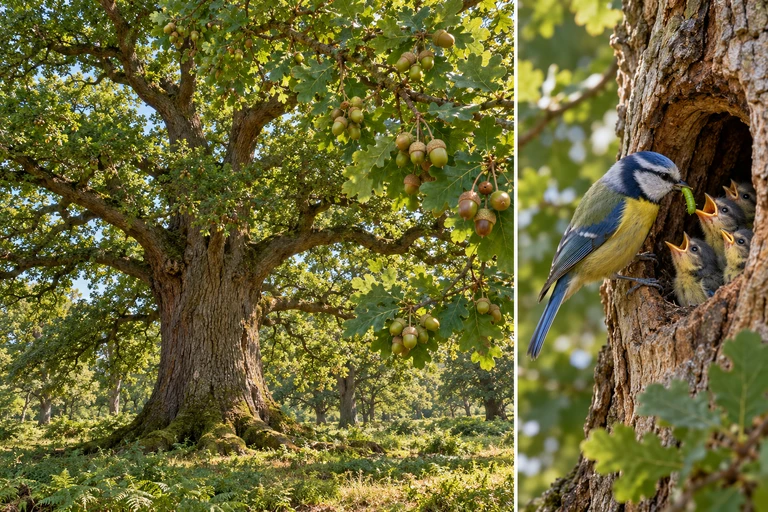
An English oak with stalked acorns and a separate blue-tit cavity-feeding scene accompany an authored mixed-trait comparison.English oak combines long life with many acorns, while blue tits invest in feeding dependent chicks. Comparing traits separately reveals combinations that a single r/K label can conceal.

Organisms combine traits rather than obeying rigid size-based categories.
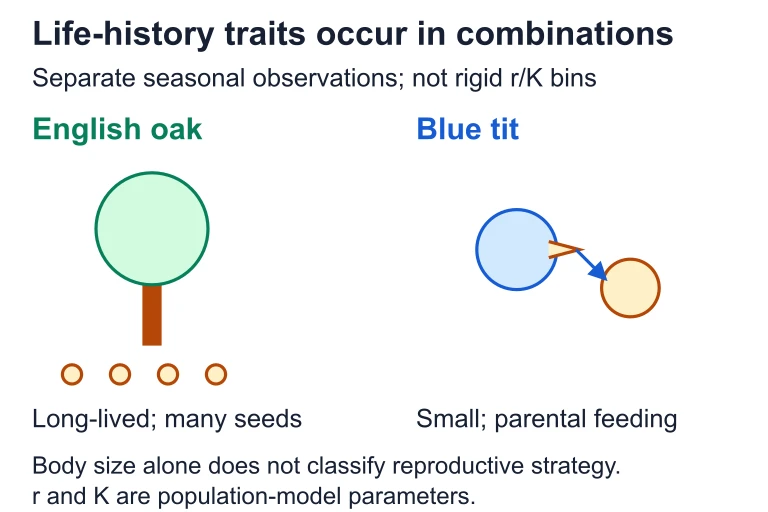
Organisms combine traits rather than obeying rigid size-based categories.. English oak combines long life with many acorns, while blue tits invest in feeding dependent chicks. Comparing traits separately reveals combinations that a single r/K label can conceal.English oak combines long life with many acorns, while blue tits invest in feeding dependent chicks. Comparing traits separately reveals combinations that a single r/K label can conceal.

Common Mistakes

✕ Binary Thinking
Treating r and K as two separate categories. In reality, it is a continuum: most species have a mix of traits.
✕ Size Equals Strategy
Assuming all small organisms are r-selected. Some small species (parrots, certain fish) show strong K-traits.
✕ Confusing r and K Symbols
Mixing up \( r \) (growth rate) with \( K \) (carrying capacity). Remember: \( r \) = rate, \( K \) = kapacity (limit).

Question 1 of 5

Which of the following is most characteristic of an r-selected species?

Question 2 of 5

In the logistic growth equation \( \frac{dN}{dt} = rN\left(\frac{K - N}{K}\right) \), the variable \( K \) represents:

Question 3 of 5

A species with a Type III survivorship curve would most likely exhibit which pattern?

Question 4 of 5

A conservation biologist is concerned about the recovery of blue whales after near-extinction from whaling. Why is recovery so slow for this species?

Question 5 of 5

Which of the following species is best described as occupying an intermediate position on the r/K continuum?