Introduction to
Biodiversity
Explore the variety of life on Earth, from genetic variation within species to the richness of entire ecosystems, and discover why biodiversity matters for our planet.
What is Biodiversity?
Biodiversity (biological diversity) is the variety and variability of life on Earth. It encompasses all living organisms: plants, animals, fungi, and microorganisms, as well as the genetic differences within them and the ecosystems they form.
The Three Levels of Biodiversity
Nested scales of biodiversity
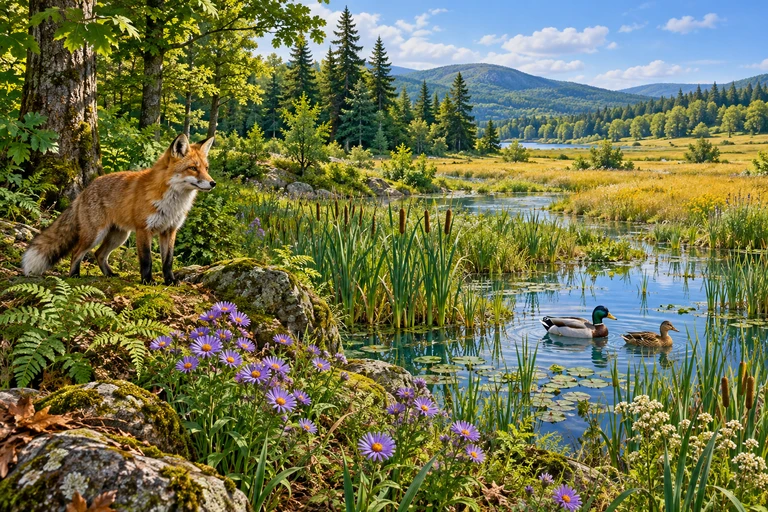 Biodiversity includes ecosystem variety across a landscape, species diversity within a community, and genetic variation within a species. At a two-allele locus, AA, Aa and aa are three genotypes formed from two alleles.
Three scales of biodiversity
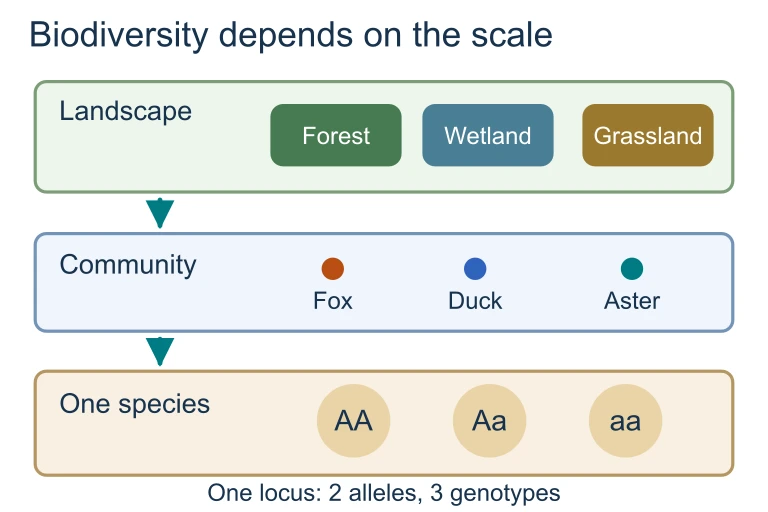 Biodiversity includes ecosystem variety across a landscape, species diversity within a community, and genetic variation within a species. At a two-allele locus, AA, Aa and aa are three genotypes formed from two alleles.
Why Does Biodiversity Matter?
Species Richness vs. Evenness
Species richness is the total number of different species present. Species evenness describes how equally individuals are distributed among those species. True biodiversity depends on both.
Measuring Biodiversity: the Shannon Index
The Shannon Diversity Index (\( H \)) is one of the most widely used metrics to quantify species diversity. It accounts for both richness and evenness:
A higher \( H \) value indicates greater diversity. If all species are equally common, \( H \) reaches its maximum value of \( \ln(S) \).
Richness vs. Diversity Index
| Species Richness | Shannon Index \( H \) | |
|---|---|---|
| What it measures | Count of species | Richness + evenness combined |
| Formula | \( S \) = number of species | \( H = -\sum p_i \ln(p_i) \) |
| Evenness sensitivity | None: ignores abundance | High: detects dominance |
| Use case | Quick field surveys | Detailed ecological analysis |
| Limitation | Incomplete picture | Requires abundance data |
How to Calculate the Shannon Index
Worked Example: Meadow Survey
A meadow contains 3 species of wildflower. A researcher counts: Species A = 40, Species B = 40, Species C = 20. Total \( N = 100 \).
Worked Example: Coral Reef vs. Tide Pool
Two marine habitats are sampled. Both contain 4 species, but their abundance distributions differ dramatically.
| Species | Coral Reef | Tide Pool |
|---|---|---|
| A | 25 | 85 |
| B | 25 | 5 |
| C | 25 | 5 |
| D | 25 | 5 |
| Total | 100 | 100 |
Biodiversity Across Biomes
Major Threats to Biodiversity
Biodiversity Hotspots
A biodiversity hotspot is a region that meets two criteria: it contains at least 1,500 endemic vascular plant species (species found nowhere else), and it has lost at least 70% of its original natural vegetation.
Ecosystem Services Powered by Biodiversity
Common Mistakes
Biodiversity Summary
| Concept | Key Idea | Example / Formula |
|---|---|---|
| Genetic Diversity | Gene variation within a species | Allele frequencies |
| Species Diversity | Richness + Evenness | \( H = -\sum p_i \ln(p_i) \) |
| Ecosystem Diversity | Variety of ecosystems | Forest, wetland, reef |
| Hotspot | >1,500 endemics + >70% loss | 36 globally recognized |
| Threats (HIPPCO) | 6 major drivers of loss | Habitat loss is #1 |
| Ecosystem Services | Benefits from biodiversity | 4 categories (MEA) |
Question 1 of 5
Which level of biodiversity refers to the variety of ecosystems in a region, such as forests, wetlands, and coral reefs?
Question 2 of 5
A community has 4 species with equal abundance (\( p_i = 0.25 \) each). What is its Shannon Diversity Index \( H \)?
Question 3 of 5
Which of the following is NOT one of the criteria for designating a biodiversity hotspot?
Question 4 of 5
In the acronym HIPPCO, what does the first "P" stand for?
Question 5 of 5
Two forests each have 10 tree species. Forest X has nearly equal numbers of each species, while Forest Y is 90% one species. Which statement is correct?