Increases in
Greenhouse Gases
Explore how rising concentrations of \(\text{CO}_2\), \(\text{CH}_4\), and \(\text{N}_2\text{O}\) drive the enhanced greenhouse effect and reshape Earth's climate systems.
What Are Greenhouse Gases?
Greenhouse gases (GHGs) are atmospheric molecules that absorb and re-emit infrared radiation. They allow incoming shortwave solar radiation to pass through but trap outgoing longwave (thermal) radiation, warming Earth's surface.
The Natural Greenhouse Effect
Why Are GHGs Increasing?
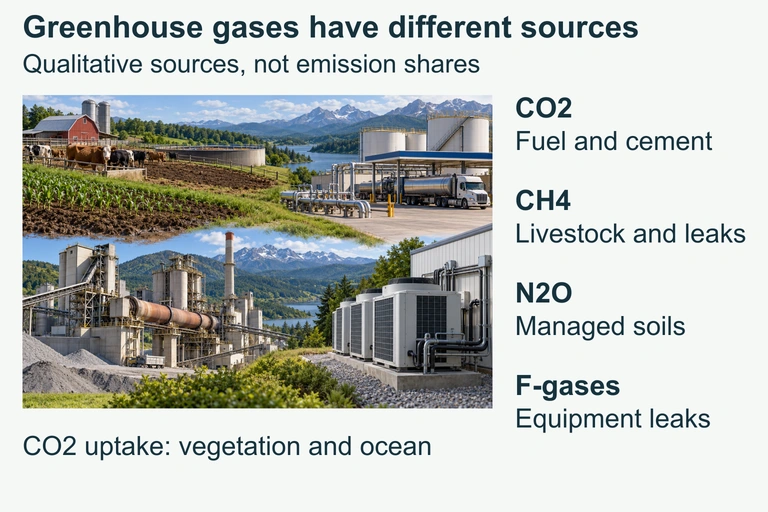
Human activities since the Industrial Revolution (~1750) have dramatically increased the concentration of greenhouse gases. The primary drivers are:
Match gas identity to source mechanism rather than treating all emissions as smokestack CO2.
Use this illustration to explore the concept described in its caption.
Atmospheric \(\text{CO}_2\) Concentration
The Enhanced Greenhouse Effect
The enhanced greenhouse effect refers to the additional warming caused by human-added GHGs above the natural baseline. More GHG molecules in the atmosphere means more infrared radiation is absorbed and re-emitted back toward the surface.
Radiative Forcing: The Core Mechanism
Radiative forcing measures the change in Earth's energy balance (in \(\text{W/m}^2\)) caused by a driver of climate change. A positive forcing warms the planet; a negative forcing cools it.
Global Warming Potential (GWP)
Global Warming Potential (GWP) compares how much heat a greenhouse gas traps relative to \(\text{CO}_2\) over a specific time horizon (typically 100 years). It accounts for both the radiative efficiency and the atmospheric lifetime of each gas.
| Gas | GWP (100-yr) | Atmospheric Lifetime | Main Source |
|---|---|---|---|
| \(\text{CO}_2\) | 1 | 300 – 1,000 years | Fossil fuels |
| \(\text{CH}_4\) | 28 | ~12 years | Agriculture, gas |
| \(\text{N}_2\text{O}\) | 273 | ~121 years | Fertilizers |
| HFCs | 1,000 – 14,000 | 1 – 270 years | Refrigerants |
Natural vs. Enhanced Greenhouse Effect
| Feature | Natural | Enhanced |
|---|---|---|
| Cause | Naturally occurring GHGs | Anthropogenic GHG emissions |
| \(\text{CO}_2\) Level | ~280 ppm | ~425 ppm |
| Warming Effect | \(+33\,^\circ\text{C}\) (life-sustaining) | \(+1.2\,^\circ\text{C}\) above baseline |
| Timescale | Equilibrium over millennia | Rapid change over decades |
| Outcome | Stable, habitable climate | Disrupted climate patterns |
Positive Feedback Loops
Rising GHGs trigger positive feedback loops that amplify warming beyond the direct radiative forcing:
Carbon Cycle Disruption
Human emissions have disrupted the carbon cycle by adding \(\text{CO}_2\) faster than natural sinks can absorb it. About half of annual emissions remain in the atmosphere.
How to Analyze GHG Data
On the AP exam, you may be asked to interpret graphs, calculate percent changes, or evaluate GHG mitigation strategies. Follow these steps:
Example 1: Percent Change in \(\text{CO}_2\)
Example 2: CO2 Equivalents
Example 3: Radiative Forcing Interpretation
Common Mistakes
Question 1 of 5
Which of the following best describes the enhanced greenhouse effect?
Question 2 of 5
A factory releases 200 kg of \(\text{N}_2\text{O}\) per year. Using a 100-year GWP of 273, what is this equivalent to in \(\text{CO}_2\) equivalents?
Question 3 of 5
Which positive feedback loop involves the release of \(\text{CH}_4\) from frozen soils as temperatures rise?
Question 4 of 5
Why is water vapor not listed as an anthropogenic greenhouse gas, even though it is the most abundant GHG in the atmosphere?
Question 5 of 5
If aerosol pollution is reduced due to clean-air regulations, what is the most likely short-term climate effect?